Fig. 4
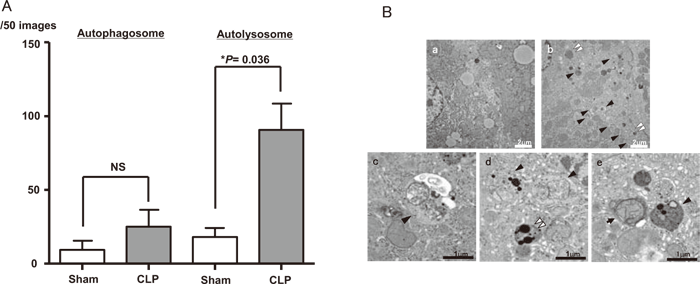
(A) The number of autophagosomes and autolysosomes are compared between CLP and sham animals.All data are expressed as the mean±SD. Data were analyzed for statistical significance using the MannWhitney test. The increase in autolysosomes in the CLP group was statistically significant(*P<0.05; n=3); the mean increases in autophagosomes in the CLP group compared to the sham group did not reach statistical significance. NS, not significant.(B) Electron microscopic images of the liver; a: Liver sample obtained from sham-operated mice. Organelles in the hepatocyte are generally intact, and lysosomes do not contain discrete membrane structures, although the non-homogeneous electron-dense material often seen in(hetero) lysosomes most certainly represents the end-stage degradation of phospholipids and other cytoplasmic materials(material at the light microscopic level referred to as lipofuscin); b-e: CLP-operated mice. Double arrow heads indicate the complex structures bounded by two membranes(autophagosomes); arrow heads indicate single membrane-bound lysosomal complexes with degraded organelle content(autolysosomes); e: the double arrow head indicates an autophagosome that clearly contains a damaged mitochondrion.