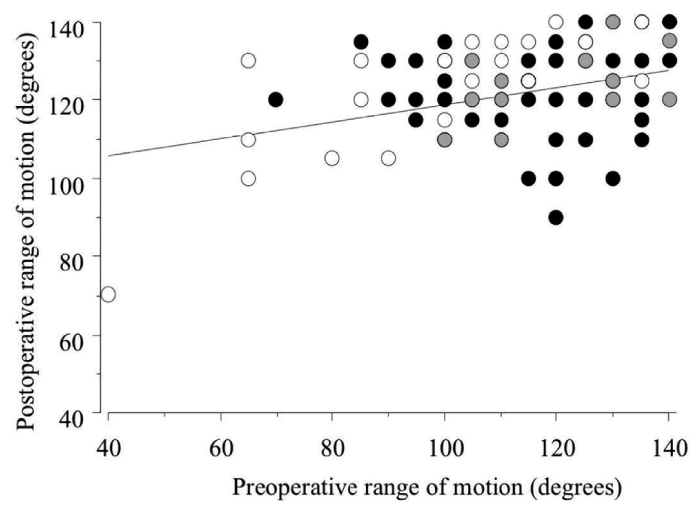
Fig. 3 Relationship of preoperative and postoperative ROM between consultant and residents
(Postoperative ROM)=97+0.2×(preoperative ROM), R=0.361, p=0.001, simple regression analysis. White dots: consultant group, black dots: residents group, and gray dots: overlapping of consultant and residents groups.
