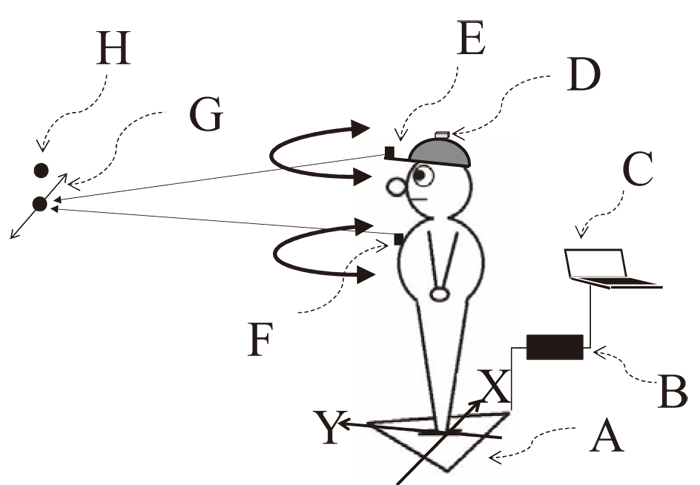
Fig. 1
Block diagram for this study. A was a force plate to record the center of foot pressure, and B was amplifier for the force plate. C was a computer to acquire the head motion and the center of foot pressure. D was a wireless accelerometer to measure head motion. E and F were laser pointers, and G was a projected point from a laser pointer. H was a fixation point. X and Y were directions of the axes for the center of foot pressure.