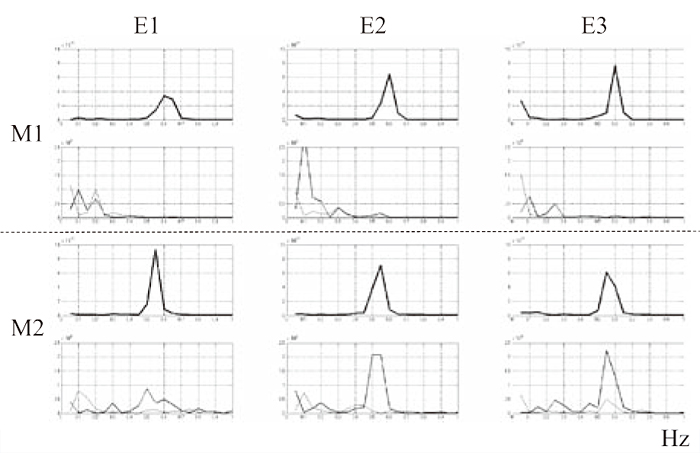
Fig. 3
Examples of the power spectra for the head motion and the center of foot pressure at a comfortable pace for one subject. Upper 2 rows M1 were power spectra with only the head, the uppermost row were those for the movements with the head only, and the second upper row were those for the center of foot pressure. Lower 2 rows M2 were power spectra with the head and thorax synchronized, the second lower row were those for the movements with the head only, and the lowermost row were those for the center of foot pressure. Thick traces for the center of foot pressure were represented for the medio-lateral oscillation, and thin traces did for the antroposterior oscillation. Column E1 represented for the movements in gazing at the laser projected point, E2 for that in gazing at the fixation point, E3 for that with eyes closed, respectively. The abscissas represented frequency in Hz.