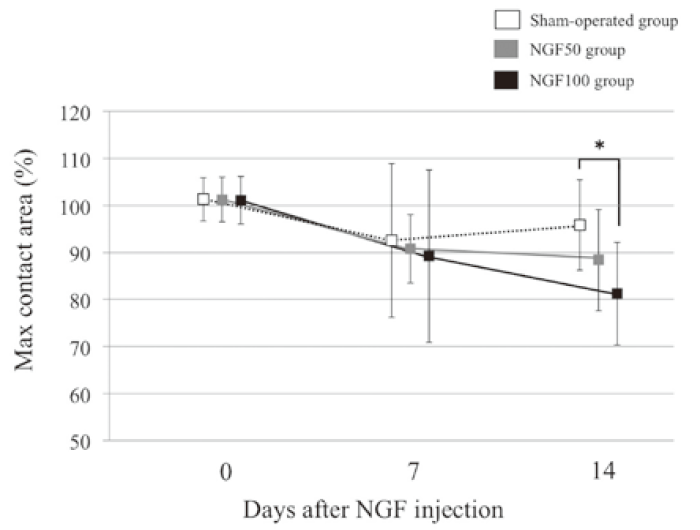
Fig. 1
Maximum contact area.
The values are adjusted by the ratio of the affected to unaffected side (%). Maximum contact area was significantly decreased in rats in the NGF100 group compared with rats in the sham-operated group on day 14. Bars represent standard deviation. *P<0.05.