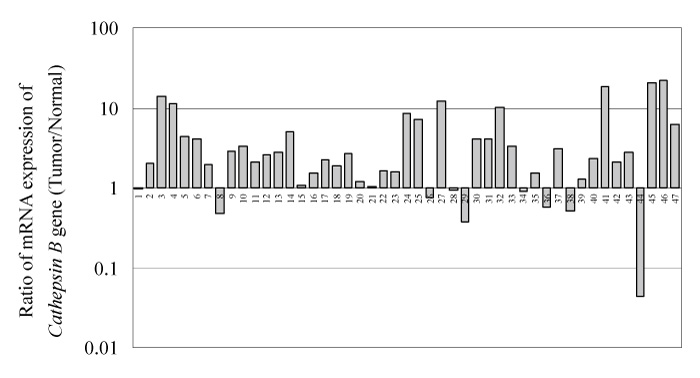
Fig. 1
mRNA expression of cathepsin B gene in OSCC samples. Relative mRNA expression between tumor and normal tissue was estimated with amounts obtained from real-time qRT-PCR analysis. Numbers shown in the bottom of columns are consecutive numbers of cases.