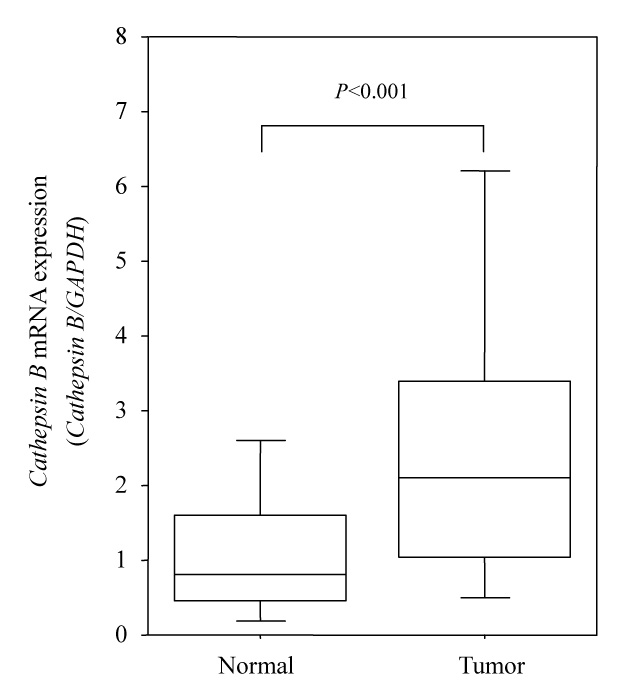
Fig. 2
Comparison of mRNA expression of cathepsin B gene between OSCCs and normal samples. Distribution of mRNA values in OSCC samples and normal tissues were expressed by box plot. Error bars indicate standard deviation (SD). Median of amounts in OSCC and normal tissue were 2.10 and 0.81, respectively, and significant difference was observed between them (P<0.001). mRNA expression is significantly greater in tongue SCC samples than normal tissues. P-value was calculated with Mann-Whitney’s U-test.