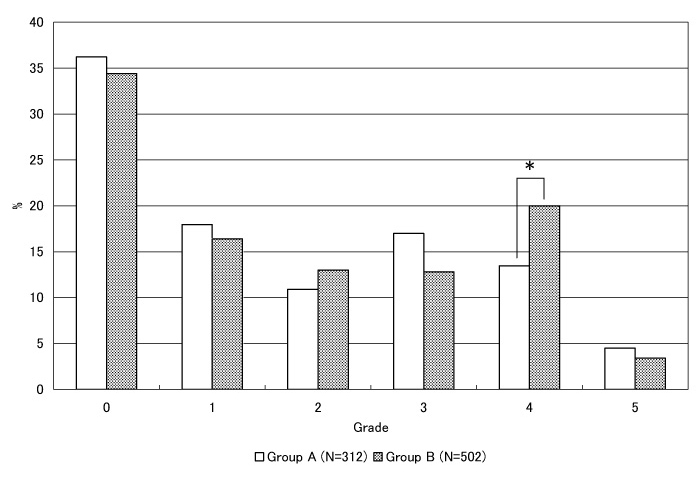
Fig. 4
Distribution of T2-elongated spot Grades in the two groups (shown in percent). Group A, self-referred subjects; Group B, third party-referred subjects.
*P<0.05 χ2 test.
Fig. 4
Distribution of T2-elongated spot Grades in the two groups (shown in percent). Group A, self-referred subjects; Group B, third party-referred subjects.
*P<0.05 χ2 test.