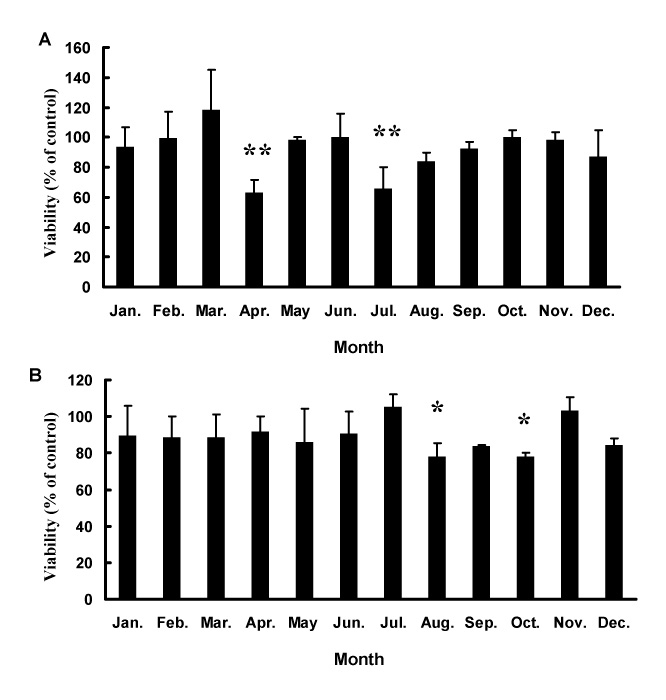
Fig. 4
Viability test of RSa cells treated with and without water samples from the Tamagawa (A) and Edogawa (B) rivers, which were collected in Ozaku and Kanamachi, respectively, every month for a year. Bars represent ±SD.*, P<0.05 vs. average, **, P<0.005 vs. average.