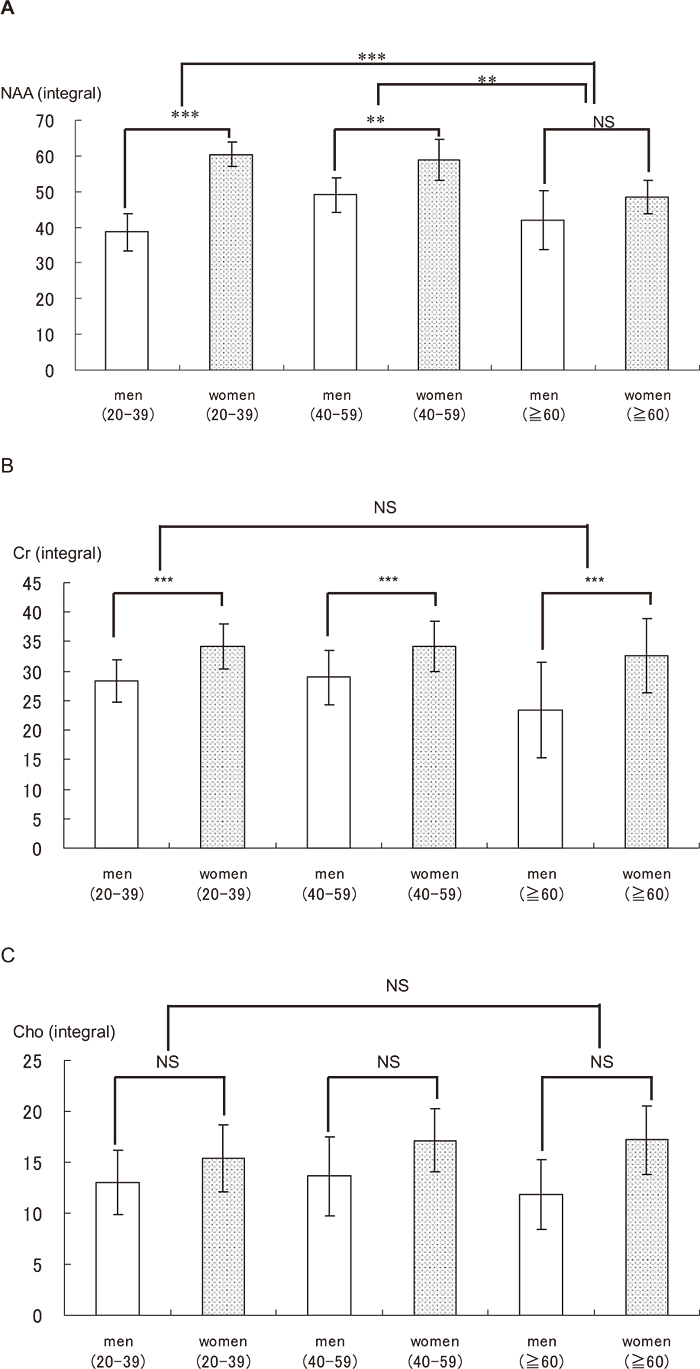
Fig. 2
The mean metabolite concentration in the visual
brain area
The concentrations of NAA(A), Cr(B), Cho(C)
between men(white) and women(black dots)
in the visual brain area with relation to age was
shown.
Note – significant correlation coefficients: **P=0.001, ***P<0.001