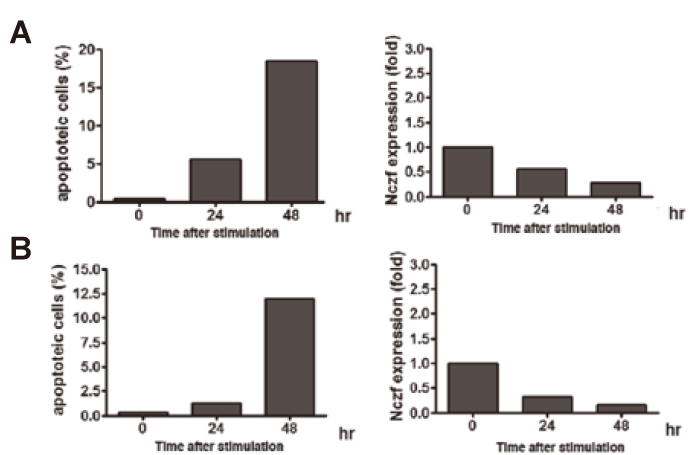
Fig. 4
Expression of Nczf after induction of apoptosis by H2O2 or ultraviolet irradiation:
(A) NIH3T3 cells were cultured in the presence of H2O2. Cells were harvested at the indicated time and percentage of apoptotic cells were examined by FACS(left panel). RNA was isolated at each time point and Nczf mRNA expression was examined by real time PCR(right panel). The data are expressed as relative to the level of control(0hr).
(B) NIH3T3 cells were exposed to 100J/m2 of UV and cultured in vitro. Cells were harvested at the indicated time and percentage of apoptotic cells were examined by FACS(left panel). RNA was isolated at each time point and Nczf mRNA expression was examined by real time quantitative PCR(right panel). The data are expressed as relative to the level of control(0hr)