Fig. 5
Knock down of Nczf in NIH3T3 cells:
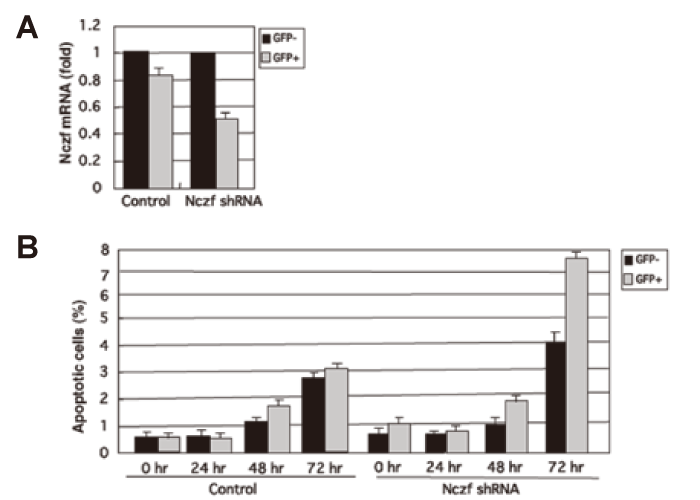
(A) Expression of Nczf mRNA in NIH3T3 cells transfected with scrambled shRNA-pSIREN ZsGreen(control) or Nczf shRNA-pSIREN ZsGreen(Nczf shRNA) vectors. Cells were collected 24hour after transfection and GFP+ and GFP- cells were separated by FACS. RNA was isolated from each population and Nczf mRNA expression was examined by real time quantitative PCR. The data are expressed as relative to the level of control(GFPpopulation). Closed bar: GFP- population, shaded bar: GFP+ population.
(B) NIH3T3 cells transfected with scrambled shRNA-pSIREN ZsGreen(control) or Nczf shRNA-pSIREN ZsGreen(Nczf shRNA) vectors were maintained in DMEM with 10% FCS. Cells were collected at indicated time points and percentage of apoptotic cells in GFP- and GFP+ populations were examined by FACS. Closed bar: percentage of apoptotic cells in GFP- population, shaded bar: percentage of apoptotic cells in GFP+ population.