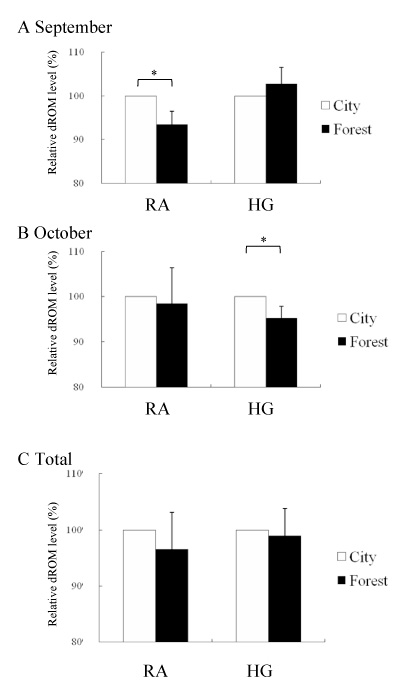
Fig. 1
Comparison of hydroperoxide concentrations in serum samples between post-urban and post-forest walking in RA patients and HG volunteers. Experiments were performed in September (A) and in October (B). Total data of each group are shown in column (C). (A) RA patients (N=5), HG volunteers (N=5). (B) RA patients (N=7), HG volunteers (N=6). White and black bars indicate relative d-ROM levels in serum samples after urban and forest walking, respectively.