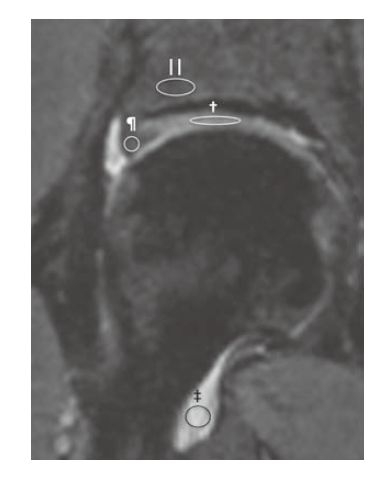
Fig. 2
The 3D-FSE Cube image demonstrating the example of ROIs on the cartilage(†), joint fluid (‡), acetablar bone(||), and labrum(¶) in the hip joint for the measurement of signal intensities.
Fig. 2
The 3D-FSE Cube image demonstrating the example of ROIs on the cartilage(†), joint fluid (‡), acetablar bone(||), and labrum(¶) in the hip joint for the measurement of signal intensities.