


Chiba Medical J. 88E:19 ~25,2012
doi:10.20776/S03035476-88E-2-P19
[Original Paper]
Satomi Ito-Shimizu1,2), Masato Maeno3)
Kenji Yanashima4) and Shuichi Yamamoto2)
1)Department of Ophthalmology, National Center for Child Health and Development, Tokyo 157-8535.
2)Department of Ophthalmology and Visual Science, Chiba University Graduate School of Medicine, Chiba 260-8670.
3)Department of Radiology, National Rehabilitation Center for the Disabled, Saitama 359-8555.
4)Yanashima Eye Clinic, Tokyo 144-0051.
(Received October 28, 2011, Accepted December 22, 2011)
To determine the concentrations of N-acetylaspartate(NAA), creatine(Cr), and choline(Cho)
metabolites in the occipital cortex of normal subjects by proton magnetic resonance spectroscopy
(1H-MRS), and to investigate the effect of aging and gender on the concentrations.
Sixty-nine normal subjects(mean age, 44.0 ± 18.1 years; range, 20 to 83 years) were studied.
Thirty-seven men and 32 women were examined by 1H-MRS with a whole-body 1.5-T magnetic
resonance system. The relative metabolic concentrations of NAA, Cr, and Cho were determined.
The significant lower concentration of NAA within the population of men and women in the
≥ 60-years-old group compare with the 20-39-years-old group(P<0.001) and the 40-59-years-old
group(P=0.001) was found. Women had significantly higher concentrations for all three metabolites
(NAA, 57.01 ± 6.48; Cr, 33.77 ± 4.45; and Cho, 16.33 ± 3.24) than men(NAA, 47.44 ± 6.19, P<
0.001; Cr, 27.55 ± 5.24, P <0.001; and Cho 12.99 ± 3.38, P <0.001). No significant effects of age and
gender were seen for any metabolite ratios.
Our results show the spectroscopic detectable NAA, Cr, and Cho metabolites in the visual cortex
and the effects of age and gender in this method.
proton magnetic resonance spectroscopy, aging, visual occipital brain, 1H-MRS, metabolite concentrations
The visual capabilities of normal humans decline
with age even without any pathological problems, and this decline is related to changes in the morphology
and physiology of the visual pathways[1-3]. Aging is
associated with neuronal dysfunction and a decrease
of neuronal and synaptic volume in the brain, and the
reduction of neuronal volume is accompanied by an increase in the number of glial cells[4]. The decrease in
synaptic proteins observed is associated with the plasticity
of axons and dendrites that contribute to cognitive
dysfunctions[4]. However, the strength of the correlation
of the visual pathway changes with normal aging has still
not been determined.
Recent improvements in magnetic resonance(MR)
imaging techniques have made it possible to obtain MR
images of the functional organization and metabolic
activity of the brain. These techniques include functional
magnetic imaging(fMRI) and magnetic resonance
spectroscopy(MRS). The MRS technique measures the
activity of metabolites quantitatively in different areas of
the brain[5-10]. As such, the MRS technique can detect
metabolic abnormalities which in some cases may be
present without any structural abnormalities in the MR
images. The MRS technique is a good method to detect
not only wide-spread metabolic disorders but also focal
tissue-specific diseases such as tumors and inflammatory
or ischemic disorders[10]. It can be used for diagnostic
and monitoring purposes in different systematic and
psychiatric diseases[5-13].
Proton magnetic resonance spectroscopy(1H-MRS)
is especially suitable for evaluating focal damage in
the visual pathway. Automation of data acquisition
has allowed this to be easily done in the clinic using
conventional MRI scanners[10]. The standard 1H-MRS
method can measure several major brain metabolites, e.g.,
N-acetylaspartate(NAA), creatine(Cr), and choline
(Cho)[5-11]. Immunohistochemical studies have shown
that NAA is exclusively expressed in neurons and is a
marker of neuronal integrity[7-10]. A reduction in the
relative concentration of NAA corresponds to neuronal
damage or loss[5-9,11].
Cr acts as a marker of the reservoir of energy and is
therefore a marker of cellular metabolism. The level of
Cr is used as an internal reference because it is relatively
resistant to brain changes[5-9,11]. Cho is present in
the plasma membrane and is a marker of cell turnover.
A reduction in the concentration of Cho is linked to
reduced cell division and pathological conditions, such as
demyelination and malignancies[5-9,11].
Earlier 1H-MRS studies reported a significant decrease in the concentrations of metabolites due to the
normal aging process but in only certain brain areas[14-18]. With improvements in the signal-to-noise ratio
by the use of single-voxel point resolved spectroscopy
sequence(PRESS) and long TE, it is now possible to
measure metabolites in different brain areas[14,19].
These 1H-MRS method can measure the concentration
of NAA, Cr, and Cho, in the occipital cortex(The
striate visual cortex(Brodmann area 17) and some
extra striate cortical areas, e.g., Brodmann area 18),
where is activated by light stimuli of different shape,
color, and intensity[11]. The purpose of this study
was to investigate the metabolite concentrations of
NAA, Cr and Cho in the visual cortical areas of normal
subjects measured by 1H-MRS, and how the relative
concentrations are affected by aging and gender.
Subjects
Sixty-nine normal subjects( mean age 44.0 ±
18.1 years; range 20 to 83 years) were recruited from
the Department of Ophthalmology of the National
Rehabilitation Center for the Disabled. The bestcorrective
visual acuity was ≥ 1.0 decimal units in all
eyes and none of the eyes has any ophthalmic diseases.
None of the subjects had any systemic diseases. There
were 37 men( mean age ± SD, 43.1 ± 18.6 years;
range, 22 to 83 years) and 32 women( mean age,
44.2 ± 17.8 years; range, 20 to 80 years).
The subjects were divided into three age groups:
the 20- to 39-years-old group included 20 men and 14
women; the 40- to 59-years-old group included 10 men
and 11 women; and the ≥ 60-years-old group included 7
men and 7 women.
The procedures used conformed to the tenets of the
Declaration of Helsinki, and an informed consent was
obtained from all subjects after the nature and possible
consequences of the study were explained. This study
protocol was approved by the IRB of the National
Rehabilitation Center for the Disabled.
Methods
1H-MRS data acquisition
Magnetic resonance(MR) images were acquired
with a 1.5-Tesla(T) magnetic resonance system
(MAGNETOM, Vision Plus, SIEMENS, Germany)
using a head coil suited for magnetic resonance imaging
(MRI) and 1H-MRS. The spectroscopic volume of
interes(t VOI) was localized in the midsagittal area of the
visual cortex and included both hemispheres(figure 1(Fig. 1))
based on T1 weighted sagittal, axial and coronal images
(scanning parameters were: TE=135 millisecond(ms),
TR=1.5 s, and 100 signal averages) with use of the
spin-echo sequence. The size of the VOI was 20×20×20mm, and the total scan time was 150 sec / voxel and
the 1H-MRS spectra were acquired with PRESS, and
chemical shift selective saturation pulse with a Gaussian
function with a half-width of 5 or 8 Hz. The integral
of each peak was determined by curve-fitting software provided manufacturer. The metabolite peaks on the 1HMR
spectrum NAA resonated at 2.01 parts per million
(p.p.m), Cr resonated at 3.03 p.p.m, and Cho resonated
at 3.20 p.p.m(Figure 1(Fig. 1)). Individual signal intensity was
used to calculate metabolite ratios(NAA / Cho, NAA /
Cr, and Cho / Cr). The MR images, typical spectrum,
and VOI position in a 22-year-old normal man are shown
in Figure 1(Fig. 1).
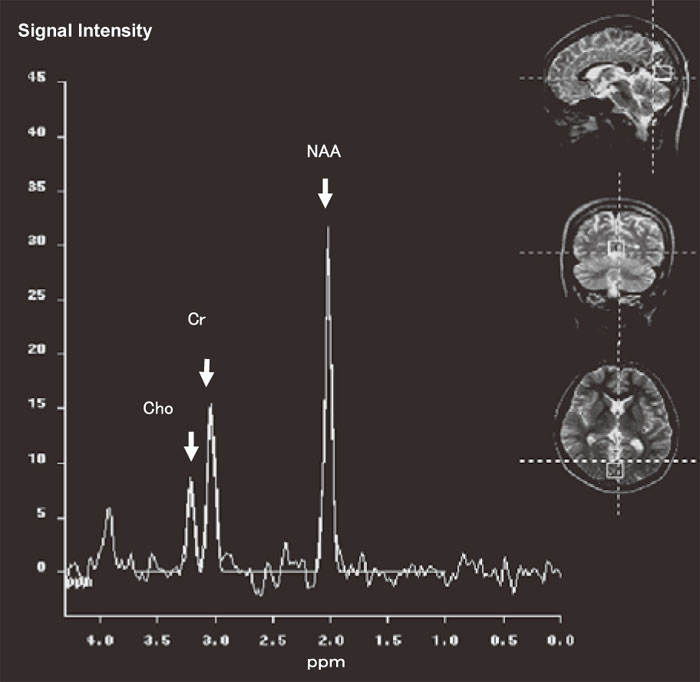
Fig. 1
Position of the volume of interest and example of a magnetic resonance sprectrum(MRS) of a 22-year-old normal man. MR images guided localization of the spectroscopic volume of interest in the occipital lobe are shown in transversal, coronal, and sagittal slices. The results of MRS are indicated as a spectrum of resonance(peaks) distributed along the X-axis labeled in parts per million(ppm). The amplitude of the resonance is measured on the y-axis using signal intensity in an arbitrary scale. The resonances of interest were N-acetylaspartate(NAA), creatine(Cr), and choline(Cho).
Statistical analyses
A one-way analysis of variance(ANOVA) was used to determine any significant differences in the concentration of the three metabolites in men and women, and among the 20-to-39-years-old group, the 40-to59-years-old group, and the ≥ 60-years-old group, and following by a post hoc test(Bonferroni’s correction). All statistical analyses were performed with the SPSS 11.0 software package(SPSS Inc., Chicago, Illinois, USA). A P<0.05 was considered statistically significant.
Results
Changes of metabolite concentrations with aging
The reductions in the relative concentrations of NAA,
Cr, and Cho with increasing age are shown in Table 1 (Table 1).
The mean metabolite concentrations of NAA(A), Cr(B)
and Cho(C) in the VOI for the three groups separated
by gender were shown in Figure 2(Fig. 2). No significant agerelated
reduction in the concentrations of Cr and Cho was
found, but in the case of NAA, there were significant
lower concentration within the population of men and
women in the ≥ 60-years-old group compare with the
20-39-years-old group(P<0.001) and the 40-59-yearsold
group(P=0.001). No significant effects of age
were seen for any metabolite ratios(Table 2 (Table 2))
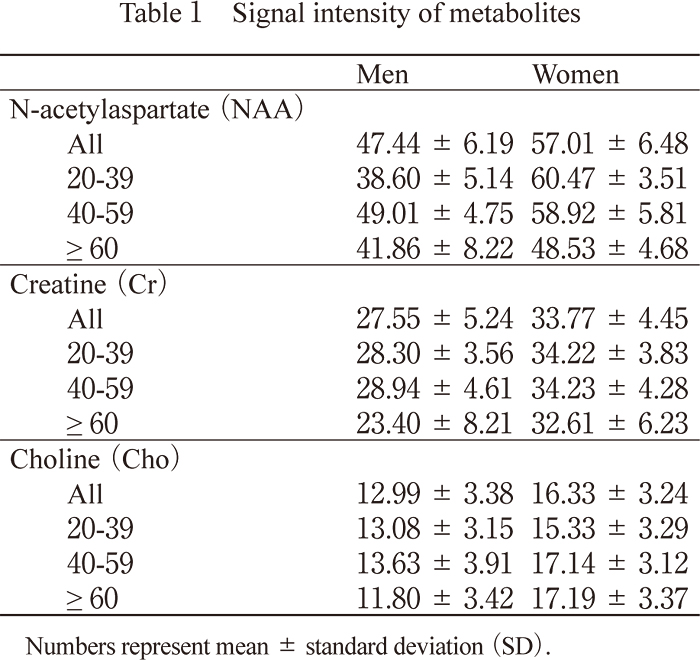
Table-1.
Numbers represent mean ± standard deviation(SD).
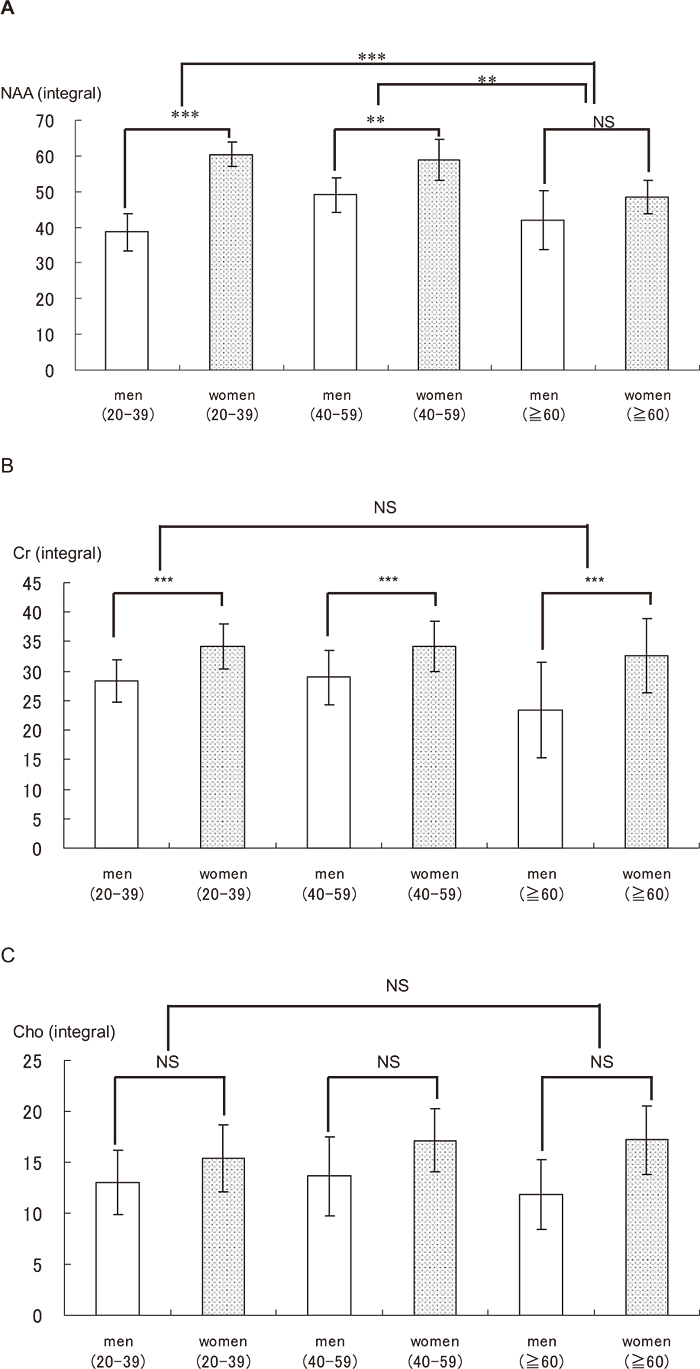
Fig. 2
The mean metabolite concentration in the visual
brain area
The concentrations of NAA(A), Cr(B), Cho(C)
between men(white) and women(black dots)
in the visual brain area with relation to age was
shown.
Note – significant correlation coefficients: **P=
0.001, ***P<0.001
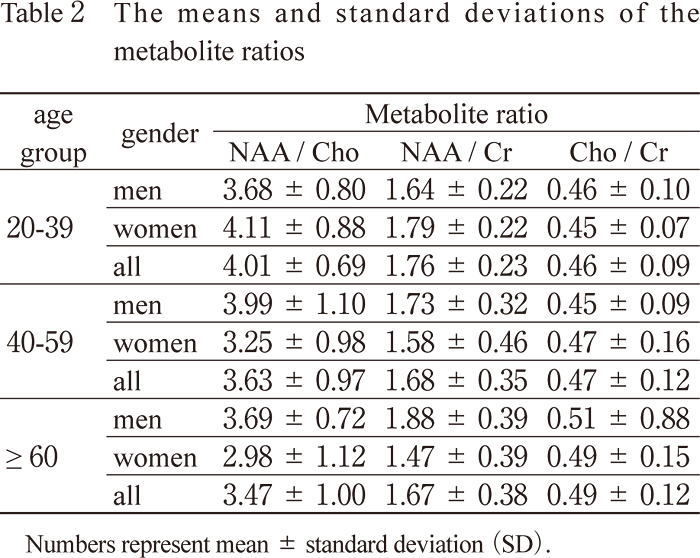
Table-2.
Numbers represent mean ± standard deviation(SD).
Gender differences
The means and standard deviations of the three metabolite concentrations for each age-group and gender are shown in Table 1 (Table 1). The concentrations of NAA(P< 0.001), Cr(P<0.001), and Cho(P<0.001) were significantly higher in women than in men for all age groups. Significant differences in the concentration of NAA between men and women was similarly found in all age groups(20-to-39-years-old group, P<0.001; 40-to-59-years-old group, P=0.001; and ≥ 60-years-old group, P=0.02). A significantly higher concentration of Cr was also found in women than in men in all three age groups(P<0.01). No significant differences in the concentration of Cho were found between women and men in 20-to-39-years-old group and 40-to-59-yearsold group, but there was a significant difference in ≥ 60-years-old group(P<0.01). No significant effects of age and gender were seen for any metabolite ratios(Table 2 (Table 2))
Our major findings were that the relative
concentration of NAA in the visual cortex decreased
in ≥ 60-years-old group, and significantly higher concentrations of NAA, Cr, and Cho metabolites were
found in women than in men for all ages.
Our findings show that a significant reduction of the
concentration of NAA in ≥ 60-years-old group; however,
no statistic reduction in the concentration of Cr and Cho
were found(Figure 2(Fig. 2)). Cr is fairly stable and commonly
used as internal standard[5-9,11]. Cho is partially
MR visible because its visible form is released under pathological conditions, such as acute myelin break down
and increased cellular density[5-9,11]. Therefore, it can
be argued that the decrease in the relative concentration
of NAA was due to a decrease in the number of cells
in the visual cortex, but this did not explain the lack
of significant changes in Cr and Cho with age. Our
NAA findings support earlier anatomical, histological,
and radiological studies that demonstrated a significant
correlation between age and neuronal dysfunction, and a
link between aging and neuronal or synaptic brain volume
decreases[4].
It has been reported that there is a significant agerelated
decrease in the NAA concentration in the
semioval and temporal area of the brain[4]. In addition,
a significant difference in the degree of decrease of the
absolute levels of NAA in the occipital cortex between
younger and older age groups has been shown, while
other metabolites did not show any significant age-related
changes[15]. Comparing these findings to our results,
a significant decrease in the NAA concentration in the
occipital cortex with increasing age as opposed to no
change in the other metabolites were found as previously
reported.
The comparison of genders showed significantly
higher concentrations of NAA, Cr and Cho in women
than in men(Table 1 (Table 1)). Previous 1H-MRS studies that
investigated metabolite differences in different brain
regions with relation to the gender in normal subjects
obtained different findings[14,20]. A set of normal
values in various brain regions was provided, but no
gender difference in metabolic ratios was found[14].
Gender differences in the CSF, intracranial volume
(ICV), and metabolite concentrations of NAA, Cr and
Cho in the parieto-occipital region were investigated by
single-voxel 1H-MRS[20]. The mean brain volume, CSF,
and ICV were significantly higher in men than women,
but the NAA /Cr ratio was not significant different in
men and women[20]. There are morphological and
biochemical differences related to gender which would
suggest that women have higher axonal density than men
[20]. Earlier studies showed that the brain of men is
larger than that of women; however, women have more
neurons[21,22]. In addition, it is known that there are gender-specific differences in the concentrations of some
of the neurotransmitters in different parts of the brain as
well as significant differences in neuronal numbers, brain
structure, and function[21,22]. These gender differences
support our findings that the concentrations of NAA, Cr
and Cho metabolites in the visual cortex are significantly
higher in women than in men for all ages.
Our findings show that no significant effects of age
and gender were seen for any metabolite ratios. Earlier
clinical applications of 1H-MRS mainly focused on
the ratios of various metabolites which were used to
set limits between normal and pathological processes.
In case of malignancy, a linear relationship between
Cho and NAA and ratio of Cho/NAA is increased
[10].The NAA / Cr ratio enable differentiation of
Alzheimer’s disease from other dementia with a relatively
high specifity and sensitivity[16]. The variability in
Cho / Cr could be biological in natural[14]. In this
study, different results between the relative metabolite
concentrations and the metabolite ratios due to normal
variation of metabolites which occurs by aging or gender,
must be more susceptible to fractional change than
pathological changes. In addition, the ratio of metabolites
can be misleading, because the concentrations of both
metabolites can change.
There are some limitations in our 1H-MRS study.
First, single-voxel MRS measurements display the
metabolite distribution, but its performance is limited
by the sensitivity of the technique. The sensitivity of
this technique can be increased by using a stronger
magnetic field[10]. Otherwise, compared with PRESS,
stimulated echo acquisition mode(STEAM) is benefit
of its shorter echo times can be used to detect small
metabolites with shorter T2 time. PRESS technique was
used in this study, because it took advantage of improved
signal intensity-to-noise ratio and simpler spectrum with
less peak interference from lipid signals and metabolite
with short T2 value, which helped in the interpretation
of the spectrum. Longer echo times, such as 270 ms can
be used, but they can get in signal intensity loss due to
T2 signal decay[4]. Kreis et al obtained five different
echo times(30, 60, 90, 135, 270 ms)spectra with
constant recovery time, the myo-inositol( together with Cho) peaks dominates at the shortest echo time. The
metabolite peak areas do not decreased exponentially
with increasing echo time, it is only at the longest echo
time that the baseline must be considerable[23]. A
TE of 135 ms was used in this study, because it can
detect under the less influence of J-modulation and T2
relaxation[4,23]. Second, the voxel was located at the
striate visual cortex(Brodmann area 17) and included
some extra striate cortical areas, e.g. Brodmann area 18.
Therefore, the examination was not limited to the visual
cortex due to technical limitations. Thus, the results do
not measure the exact visual areas but contains other
areas. Third, we applied the same size of voxel for all
subjects, even though women have smaller brains and
would have a relatively larger VOI value than men. The
voxel is composed of different amounts of white and gray
matter and cerebrospinal fluid(CSF) for each subject.
The concentrations of metabolites of interest are lower
in CSF or extracellular space[14,17]. It is not possible
to precisely determine the amount of gray and white
matter that is contained in each VOI. The difference in
distribution of metabolite concentrations in gray and
white matter must be determined by more advanced MR
techniques with improved spatial resolution.
Despite these limitations, our data were acquired
by a 1.5-T MR system so that this could be a simple
and valuable procedure that can be used under clinical
conditions. Consequently, our results show the
spectroscopic detectable NAA, Cr, and Cho metabolites
in the visual cortex and the effects of age and gender in
this method.
Our deepest thanks go to Christine C. Boucard for providing advice and encouragement, and Duco Hamasaki, PhD for editing the manuscript.
Abbreviations: proton magnetic resonance spectroscopy (1H-MRS), N-acetylaspartate(NAA), creatine(Cr), choline (Cho), volume of interest(VOI), visually evoked potentials (VEPs), cerebrospinal fluid(CSF), intracranial volume(ICV)
Address correspondence to Dr. Satomi Ito-Smizu.
Department of Ophthalmology, National Center for Child Health and Development, 2-10-1 Okura, Setagaya-ku, Tokyo 157-8535, Japan.
Phone: +81-3-3416-0181. Fax: +81-3-3416-2222.
E-mail: simisato@sa2.so-net.ne.jp