


Chiba Medical J. 89E:21~27,2013
doi:10.20776/S03035476-89E-4-P21
[Original Paper]
Atsunori Sakama 1,6), Satoki Zenbutsu 2), Masahito Inoue 5,6)
Toshiya Nakaguchi 3), Norimichi Tsumura 4), Yoshiyuki Watanabe 5)
Daisuke Horibe 1), Mari Kuboshima 1,6), Toshio Tsuyuguchi 5)
Yoichi Miyake 2), Hisahiro Matsubara 1) and Hideki Hayashi 2)
(Received February 5, 2013, Accepted May 16, 2013)
Aim: The goal of the study was to examine the performance of an image enhancement technique based on multispectral estimation(MSE) for detection of minor changes and boundaries of gastric mucosal lesions.
Methods: Reflectance spectra of the gastric mucosa were estimated through red, green and blue (RGB) color signals from a conventional endoscope using the Wiener estimation method. Single-band images(n=61, wavelength 400-700 nm, 5-nm slices) were generated by assignment of any three of these spectral images of arbitrary wavelengths to R, G, and B image planes. The optimum combination of wavelengths was determined and the quality and clinical value of the synthesized images were evaluated.
Results: A combination of 550 nm(R), 500 nm(G), and 470 nm(B) wavelengths gave optimal images of the gastric mucosa. The image quality was 0.624 on a scale from 0.0(original RGB image) to 1.0(original image with dye-spraying). In endoscopic screening of the stomach, the rates of biopsy and lesion detection were 15.6% and 0.19%, respectively, without MSE, and 16.5% and 0.37%, respectively, with MSE.
Conclusions: Images with better contrast were obtained with MSE, which suggests that this approach may be useful in endoscopic screening of minor gastric mucosal changes.
image-enhanced endoscopy, flexible spectral imaging color enhancement, early detection of cancer, screening, gastric cancer
Improvement in performance of endoscopic imaging devices has increased detection of early gastrointestinal cancers [1-3]. In parallel, techniques such as endoscopic submucosal dissection(ESD) have been developed for removal of larger gastrointestinal mucosal lesions [4]. Techniques for improved accuracy of detection of the horizontal extent and depth of tumor invasion have also been developed, including magnifying endoscopy, narrow band imaging (NBI), endocytoscopy, and autofluorescence imaging [5,6]. NBI has attracted particular attention due to the improved image quality for fine structures of the gastrointestinal mucosa produced by adjusting spectral features using the wavelength dependence of the tissue penetration depth of light [7,8]. NBI is a useful technique for detection of minor gastrointestinal lesions, but requires costly hardware including narrow-band filters. A further limitation of NBI is that spectral features cannot be adjusted according to organs and disease.
Estimation of spectral reflectance of skin and gastrointestinal mucosa from conventional color images with red(R), green(G), and blue(B) channels can be performed using an image processing algorithm [9-11]. This technique is based on multispectral estimation (MSE) and can be used to estimate spectral images of an object with a single wavelength light source without requiring specific optical hardware such as narrow band filters. The MSE image processing system can be installed onto all currently available commercial electronic endoscope systems and has scalability that allows adjustment to the spectral properties of objects.
In this study, the performance of the MSE technique was tested using clinical images. The clinical efficacy of the system was also evaluated in endoscopic screening of the stomach for detection of minor gastric mucosal lesions.
Instruments
Image processing was performed using MATLAB7.0 (MathWorks, Inc., Massachusetts, U.S.A) and Visual C++ (Microsoft Corp.). A Pixus iP8600 printer (Canon Inc., Tokyo, Japan) and a 707jp personal computer(Gateway, Irvine, CA, U.S.A.) were used for composition and output of images. A multispectral EPX4400 endoscope system with flexible spectral imaging color enhancement(FICE), an EPX4450 (Advancia), and EG-590WR, EG-590ZW, and EG- 530NW endoscopes(Fujinon Corp., Saitama, Japan) were used to collect clinical data.
Image processing procedures
The core element of the MSE procedure is the Wiener estimation method, as described in detail elsewhere [10]. A Wiener matrix was calculated from the spectral reflectance of a Macbeth color chart measured using a CS1000 spectrophotometer (Konica Minolta Holdings, Inc., Tokyo, Japan) and corresponding RGB endoscope response. Based on the Wiener matrix, 61 spectral images were calculated for a single wavelength source(400 to 700 nm, at intervals of 5 nm). Three estimated spectral images of arbitrary wavelengths were assigned to R, G and B image planes to synthesize enhanced images [10]. The original images were selected from endoscopic images recorded at Chiba University Hospital(Department of Frontier Surgery and Department of Optical Diagnostics and Therapeutics) from May 2004 to September 2006.
Evaluation of synthesized images
Pairwise comparison was used to evaluate the utility of the synthesized images relative to the original images with or without dye-spraying using indigo carmine. Comparisons were made for the original image without dye-spraying with the synthesized image, the original image with dye-spraying with the synthesized image, and the original image with and without dye-spraying. In each pairwise comparison, 11 endoscopic physicians in our hospital gave their opinion of which image was clearer and the results were tabulated [12].
Evaluation of clinical efficacy in screening of the upper gastrointestinal tract
The subjects in this part of the study were patients who visited Asai Hospital Medical Checkup Center and underwent screening of the upper gastrointestinal tract between April 2009 and March 2011. All patients were examined with an EPX4450 (Advancia) endoscope system(Fujinon Corp., Saitama, Japan). Biopsy sampling rate, lesion detection rate, and total screening time(defined as the time from pretreatment of the pharynx to leaving the examination room) were recorded. Endoscopic screening was performed by one of two specialists approved by the Japan Gastroenterological Endoscopy Society. The MSE method was introduced in April 2010. Therefore, data were compared between patients treated in April 2009-March 2010 (before introduction of MSE) and those treated in April 2010-March 2011(after introduction of MSE).
Spectral image analysis of gastric mucosal lesions
Sixty-one spectral images(400 to 700 nm, intervals of 5 nm) were generated from conventional color images of gastric mucosa taken through electronic endoscopes with a RGB three-band CCD. Each spectral image was examined carefully. Generally, images obtained with short wavelengths(400 to about 550 nm) accentuated surface structures and mucosal vessel patterns of gastric mucosa. In contrast, images obtained with longer wavelengths(>600 nm) were white-like and less informative for examination of the mucosal surface (Fig. 1).
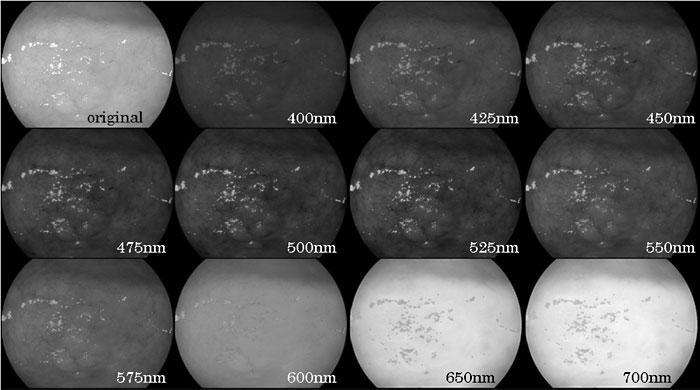
Fig 1
Series of single band images of the gastric mucosa obtained with a single wavelength light source(400 to 700 nm, collected every 5 nm) using conventional RGB endoscopic imaging.
Composition of enhanced images
Color images were synthesized by assignment of any three estimated spectral images of arbitrary wavelength to R, G and B image planes. Theoretically, 61 combinatorial choices of wavelength were available. Ideally, all images should be evaluated to determine a combination appropriate for endoscopic observation, but realistically it is impossible to examine all synthesized images because an image has over 220,000 combinations(61×61×61=226,981). Therefore, we began by examining combinations for 7 images at 400, 450, 500, 550, 600, 650, and 700 nm(7×7×7= 343) to exclude images with clearly low visibility for a lesion, excessively bright images, and excessively dark images. We then examined the remaining combinatorial choices of wavelength at intervals of 20 nm, 10 nm, and 5 nm for surrounding wavelength bands in this order. Finally, a combination of R550, G500 and B470 nm was selected because these wavelengths had high average levels of gradation, sharpness, noise, and color reproduction in multiple lesions, and borders of lesions and patterns of microscopic vessels were clearly visible (Fig. 2)
. Thus, this combination of wavelengths was used for the electronic endoscope system and five gastric mucosal lesions were observed with this system.
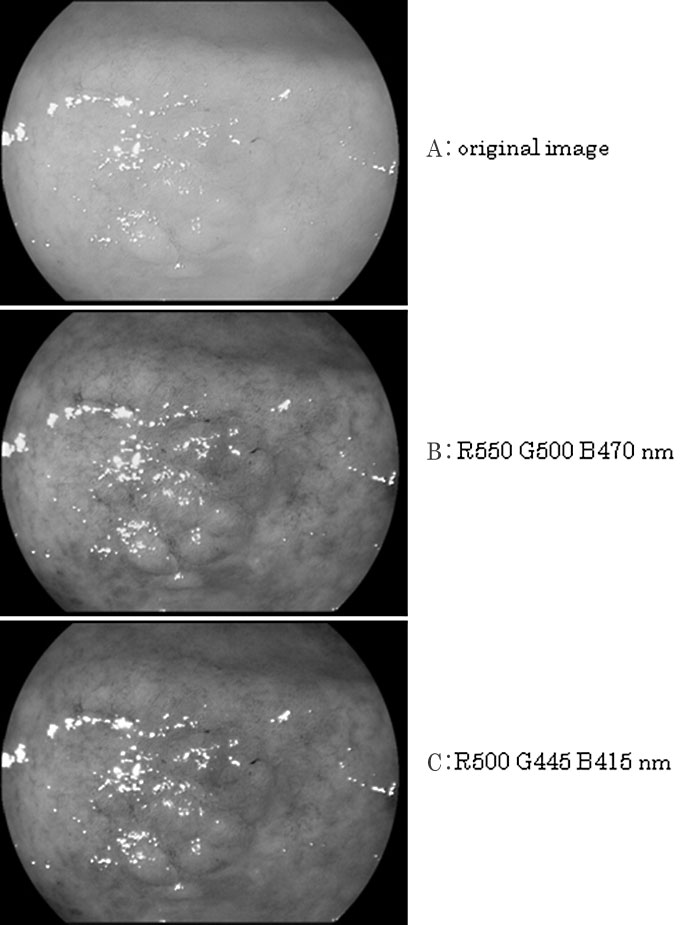
Fig 2
A; Original endoscopic image of the gastric mucosa.
B; synthesized images based on assignment of estimated single-band images of arbitrary wavelength to RGB image planes.
C; Wavelength combination used in the Early NBI system(Olympus). The current NBI system uses a combination of R540 nm, G415 nm and B415 nm.
Evaluation of synthesized images by pairwise comparison
Five gastric mucosal lesions(3 early cancers and 2 scars after endoscopic mucosal resection of early cancers) were examined using the electronic endoscope system (Fig. 3). Panels of the original RGB image with or without dye-spraying and the synthesized image were printed out for each lesion. Arbitrary pairs of these panels for each disease were presented to an endoscopic physician who was asked to judge which image provided better contrast of disease boundaries and vascular patterns. Eleven physicians in our hospital with a mean of 9 years(range 1 to 11) of endoscopic examination experience participated in the study. The number of votes for each image was collected (Table 1). In pairwise comparison of original RGB images without dye-spraying and synthesized images, the physicians felt that the synthesized image was superior in 80% of comparisons. The synthesized image was judged to be superior to an original image with dye-spraying in only 29 % of cases. However, this was higher than the 15% of cases in which an original image without dyespraying was judged to be superior to an image with dye-spraying. Image quality distance analysis of the synthesized images was performed on a scale from 0.0 (original image without dye-spraying) to 1.0(original image with dye-spraying), based on Thurstone’s law (case V) of comparative judgment. The image quality distance of the synthesized images was determined to be 0.624 (Fig. 4).
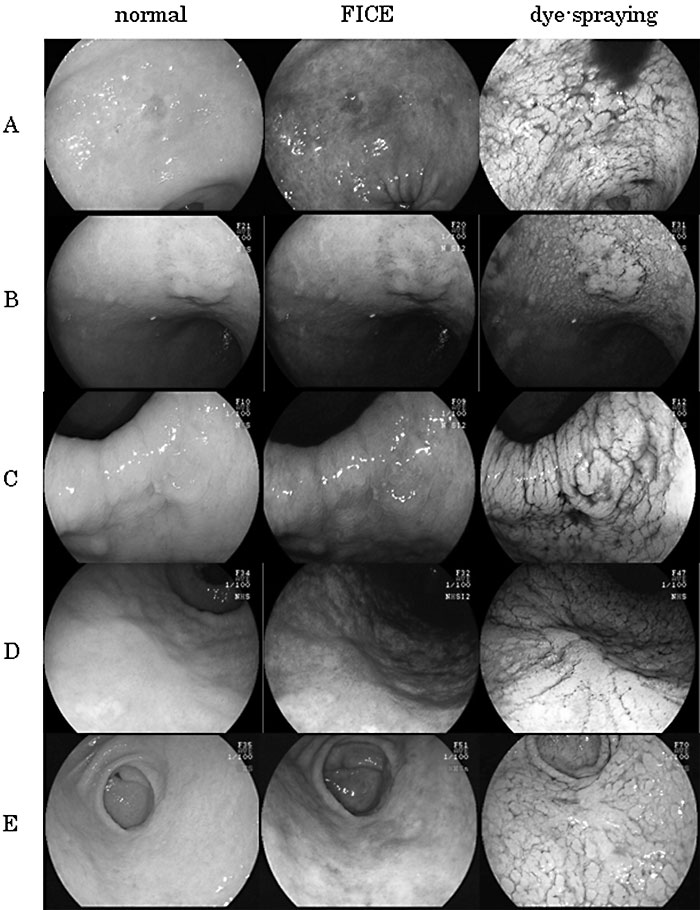
Fig.3
Comparison of synthesized images with normal and dye-spraying images.
A; Signet ring cell carcinoma of 3.0 cm in diameter, showing depressed early gastric cancer in the lesser curvature of the lower stomach.
B; Well differentiated tubular adenocarcinoma of 1.3 cm in diameter, showing raised type early gastric cancer in the lesser curvature of the middle stomach.
C; Moderately differentiated tubular adenocarcinoma of 1.0 cm in diameter, showing depressed type early gastric cancer with accompanying erythema in the lesser curvature of the lower stomach.
D; A scar with accompanying erythema observed after endoscopic mucosal resection (EMR) of early gastric cancer in the curvatura ventriculi major of the middle stomach. No malignancy was revealed in this case.
E; A scar with accompanying erythema observed after EMR of early gastric cancer in the curvatura ventriculi major of the lower stomach. No malignancy was revealed in this case.
Table 1
Evaluation of original and synthesized images using pairwise comparison. †
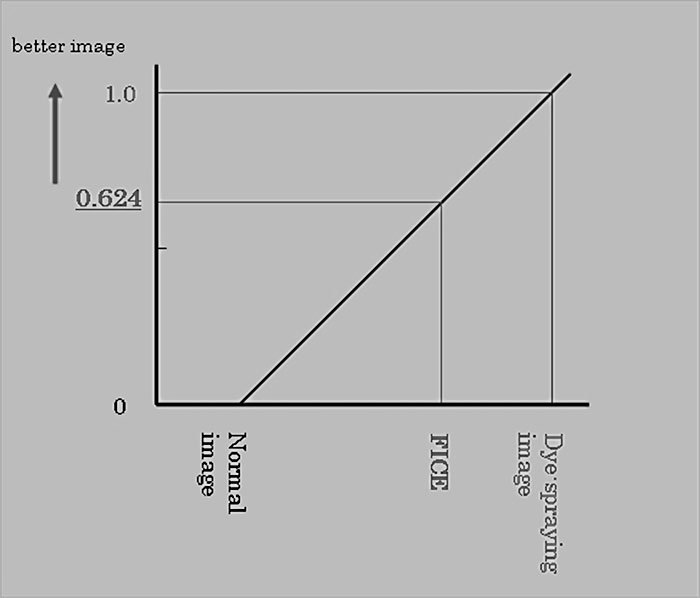
Fig.4
Image quality distance analysis of normal, dyespraying and synthesized images of gastric mucosal lesions in the cases shown in Table 1. The results were quantified based on pairwise comparison of images. The image quality distance of the synthesized images was 0.624 on a scale from 0.0 for original images to 1.0 for dye-sprayed images.
Evaluation of clinical efficacy in screening of the upper gastrointestinal tract
The biopsy sampling rate, lesion detection rate, and positive predictive value of the biopsy in endoscopic screening of the stomach were 15.6%, 0.19%, 1.19%, respectively, without MSE; and 16.5%, 0.37%, 2.22%, respectively, after introduction of MSE. These results indicate increased efficacy due to MSE, but the changes were not significant (Table 2). The time required for screening with(n=75 cases) and without(n=68 cases) MSE were similar(28.2±5.7 vs. 28.4±5.4 min, P=0.832).
Table. 2
Total number of patients, biopsies, identified lesions, and positive predictive value for lesions (number of identified lesions/number of biopsies) with and without use of MSE. †
Most current commercial endoscope video systems reproduce the peak wavelengths of primary colors (red; ~700 nm, green; ~546 nm, Blue; ~436 nm) in the CRT display. However, our analysis of the gastric mucosa showed that spectral images at >600 nm were less informative for analysis of the surface details of the gastrointestinal mucosa [13]. In other words, conventional endoscopic video images contain redundant information for examination of the gastrointestinal surface. Actual reflectance analysis of a gastric mucosa indicated a wide variance of reflectance, especially around 500 nm, between the inside and outside of a mucosal lesion (Fig. 5) [14]. Theoretically, single-band images within these wavelengths should be more informative for examination of the mucosal surface and composition of these images could produce color images with more distinct boundaries and vascular patterns of mucosal lesions.
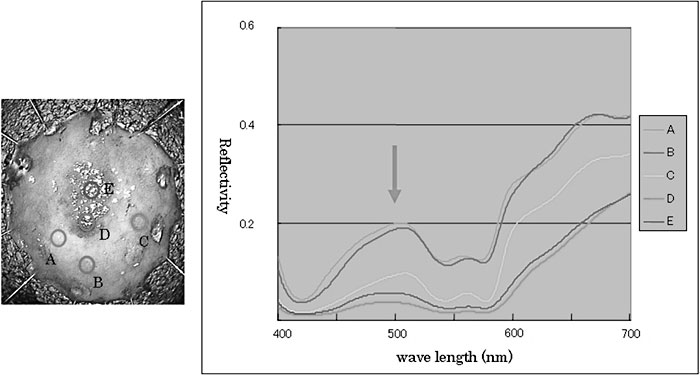
Fig.5
Reflectance spectra of an excision sample of early gastric cancer. The cancer was a well differentiated tubular adenocarcinoma of the elevated type that was resected by endoscopic submucosal dissection.
In this study, a combination of wavelengths of 550 nm(R), 500 nm(G), and 470 nm(B) provided the best synthesized image with which to examine surface details of the gastric mucosa. Pairwise comparisons gave an image quality distance of the synthesized images of 0.624 on a scale from 0.0(original image without dye-spraying) to 1.0(original image with dyespraying). These data indicate the contribution of the MSE system to examination of the gastric mucosa and show that the new endoscope system has advantages for gastrointestinal screening. However, it should be noted that scattering of dye may blur observation of minor vessel patterns of lesions and the dye itself can also cause anaphylactic shock, although at a very low frequency.
In NBI, a combination of light sources of ≤ 540 nm (540 nm(R), 415 nm(G), 415 nm(B)) can be used to reproduce color images [15]. These images clearly depict minor mucosal changes in the gastrointestinal tract. However, the chosen wavelengths overlap with the maximum absorption range of wavelengths of oxyand deoxyhemoglobin. Although mucosal vessels are clearly depicted in NBI with this wavelength setting, the images are dark under the usual setting of wideangle observation for the gastric mucosa because of insufficient illumination stemming from the basis of NBI. The MSE system with the same combination of wavelengths also gave dark and monotonous images of the gastric lumen. However, the software in this system can be used to adjust the flexibility of the wavelength combination and luminance of the RGB setting independently, which makes it feasible to refine the synthesized images. Furthermore, the system has the ability to mount a dual display of original and synthesized images at the same time [16,17]. Simultaneous viewing of the two images can facilitate quick and precise screening of the stomach.
Evaluation of MSE in clinical screening of the upper gastrointestinal tract did not show a significant differences compared with the conventional RGB system. This may be due to the small sample size in the study because the prevalence rates of gastric lesions are relatively low. The total screening times were similar with or without use of MSE, suggesting that this approach does not increase the time for endoscopic screening due to swift switching to synthesized images and a reduced need for dye-spraying.
In conclusion, the MSE method can be used for real-time spectral analysis of the gastrointestinal surface and reproduction of color images from arbitrary combinations of wavelengths. This has the advantage of reproducing NBI-like images without the need for specific and costly optical hardware. These features also suggest that individual optimal settings could be used based on the pathogenetic background of mucosal changes of a patient, such as atrophy or intestinal metaplasia [18,19]. Further technological and clinical studies will be required to examine the usefulness of this new electronic endoscope system.
We express our deepest gratitude to the late Professor Teruo Kozu(former chairman of the Department of Optical Diagnostics and Therapeutics, Chiba University Hospital) for his many words of encouragement and advice. We offer prayers for the repose of his soul.
1) Department of Frontier Surgery, Graduate School of Medicine, Chiba University, Chiba 263-8522.
2) Research Center for Frontier Medical Engineering, Chiba University, Chiba 260-8677.
3) Department of Medical System Engineering, Faculty of Engineering, Chiba University, Chiba 260-8670.
4) Department of Information and Image Sciences, Faculty of Engineering, Chiba University, Chiba 260-8670.
5) Department of Optical Diagnostics and Therapeutics, Chiba University Hospital, Chiba 263-8555.
6) Asai Hospital Endoscopy Center, Togane 283-8650.
Abbreviations: IEE, Image-Enhanced Endoscopy; FICE, Flexible spectral Imaging Color Enhancement; RGB, red, green and blue
Address correspondence to Dr. Atsunori Sakama.
Asai Hospital Endoscopy Center, 38-1 Katoku, Togane city, Chiba Pref. Togane 283-8650, Japan.
Phone: +81-475-58-5000. Fax: +81-475-58-5549.
E-mail: sakama@asaihospital.com