


Chiba Medical J. 90E:13~19,2014
doi:10.20776/S03035476-90E-3-P13
[Original Paper]
Ryu Matsuura 1) , Takahisa Sasho 1) , Satoshi Yamaguchi 1) , Tomonori Kenmoku 1) , Hiroaki Tsuruoka 1) , Kei Matsuki 1) , Nobuyasu Ochiai 1) , Koichi Nakagawa 2) , Masahiko Saito 2) , Toshiya Nakaguchi 3) ,
Yoichi Miyake 3) and Kazuhisa Takahashi 1)
1) Department of Orthopedic Surgery, Graduate School of Medicine, Chiba University, Chiba 260-8670.
2) Department of Orthopedic Surgery, Sakura Medical Center, Toho University, Sakura 285-8741.
3) Graduate School of Engineering, Chiba University, Chiba 263-8522.
(Received March 11, 2014, Accepted April 1, 2014)
Osteoarthritis of the knee joint( KOA) is an important problem to be solved in aged society. Objective assessment of disease progression is mandatory for establishing adequate treatment system. Radiographic examination is a standard method but it is too rough to detect subtle changes occur in limited period. Contrary to this, magnetic resonance imaging( MRI) is expected to work as biomarker as it appears to be keen enough to capture subtle changes. Several MRI-based assessment systems have been developed to assess the status of KOA but they are too complicated and time consuming. Originally developed system, the Irregularity Index System( I-I System) is one of those but the simplest method because it is composed of only one item; i.e., the contour of the femoral condyle. Cross-sectional study revealed good correlation between irregularity of the contour and clinical severity but longitudinal changes are yet to be solved. In this paper longitudinal change of irregularity was determined using publicly available MRI data base concerning KOA. As a result, I-I System could detect changes over average of 14 months and it related to deterioration of clinical knee score.
Osteoarthritis of the knee, MRI, OAI
Osteoarthritis of the knee joint(KOA) is becoming an increasingly important problem as the population ages. Many KOA intervention trials have been performed[1-4], and additional studies are expected to be conducted until an effective treatment regimen is established. Objective assessment of disease progression is critical for identifying effective treatment options. Radiographic examination is a standard method for measuring changes in joint space narrowing under fluoroscopic guidance[5], and is presently considered to be the most reliable method for evaluating the structural changes that occur in cartilage. MRI-based assessment of volumetric changes in cartilage is also potentially useful[6-8]. Semi-quantitative MRI scoring methods might be promising[9-12]. However, these methods appear to be beyond the reach of general daily clinical practice, as they are all time-consuming and laborintensive.
In our previous study, we established a new procedure, called the Irregularity Index System(I-I sytstem), which enables objective assessment of disease severity of KOA using standard sagittal protonweighted MRI. Newly-developed software facilitated the measurement of irregularity in the contour of the femoral condyle, in which the calculated value was well correlated with functional knee score[13]. I-I system have been proved to give equivalent assessment to representative semi-quantitative system[14]. But longitudinal changes observed with I-I system are to be determined.
In the present study, the I-I System was used to evaluate changes of femoral condyle irregularity that occurred over a 14-month interval to determine whether they could function as possible indicators of disease progression, where x-ray examination would not show any changes with this period.
A data set(version 0.2.1) downloaded from the Osteoarthritis Initiative(OAI) at the University of California; San Francisco(UCSF) was utilized in this study. OAI is publicly available data set concerning knee OA and includes imaging data and clinical data. Knees that underwent two MRI examinations, ie, at study entry and at 9- to 16-month follow-up(average, 13.6 months), were selected. Among a total of 200 knees available from the OAI, one quartile of knees (ie, 50 knees) were randomly selected for inclusion in the present study. Among the several types of data contained within the OAI data set, patient demographics and the Western Ontario and McMaster Universities Arthritis Index(WOMAC) were utilized in addition to MRI data. The OAI provided bilateral knee image data; however, T2 map data, which were used for assessment of contour irregularity of the femoral condyle, were only available for right knees. Therefore, only right knees were evaluated in the present study. Calculation of the degree of irregularity of the contour of the femoral condyle was performed using software specifically developed for this purpose, as summarized in Figure 1. Firstly, Digital Imaging and Communications in Medicine(DICOM) data were input into the computer (Fig. 1a). Secondly, captured images were converted into black and white images(Fig. 1b). Thirdly, the contour of the femoral condyle was extracted, and the dimensions of both the upper and lower surfaces of the extracted contour were determined(Fig. 1c, d). Lastly, four parameters related to the degree of irregularity of the contour were automatically calculated: (a) average thickness of the contour (ATC, tentative units);(b) ratio of the length of the upper surface of the contour to that of the lower surface(RUL);(c) average squared thickness of the contour(ASTC); and (d) standard deviation of the thickness of the contour (SDC). Theoretically, as the irregularity becomes more obvious, ATC, RUL, ASTC, and SDC should increase. Our previous study demonstrated that the values of these four parameters were well correlated with knee function scores as well as the degree of pain assessed using a visual analogue scale(VAS)[13]. T2 map sagittal slices were assessed(field of view[FOV], 120 mm; slice thickness, 3 mm; skip: 0.5 mm; echo time [TE], 10, 20, 30, 40, 50, 60, and 70; and repetition time[TR], 2,700) with a 3T scanner(Trio, Siemens). Three sagittal slices from the center of the medial or lateral compartment were measured, with the average assigned as the compartment's value. The more severe value of the medial femoral condyle(MFC) or lateral femoral condyle(LFC) irregularities was assigned as a knee's value. Relationship between WOMAC socore and four parameters were examined cross-sectionally and longitudinally.
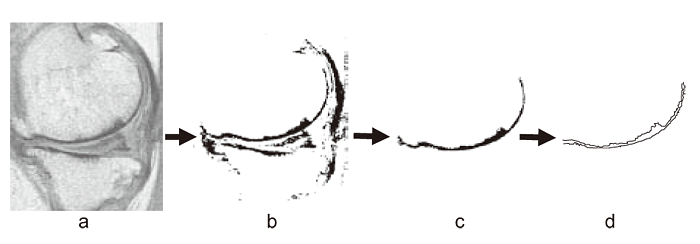
Fig.1 Irregularity Index System procedure
Firstly, DICOM data were input into the computer(Fig. 1a).
Secondly, captured images were converted into black and white images(Fig. 1b).
Thirdly, the contour of the femoral condyle was extracted, and the dimensions of both the upper and lower
surfaces of the extracted contour were determined(Fig. 1c, d).
Eight knees that received total knee arthroplasty (TKA) following MRI assessments were used. At the time of TKA, the weight-bearing areas of the MFC and the LFC were obtained. Specimens were immediately fixed in 4% paraformaldehyde in phosphate-buffered saline for 24 hours. The MFC and the LFC were demineralized in 20% ethylenediaminetetraacetic acid (EDTA) at room temperature for 6 weeks. They were then embedded in paraffin. Sagittal sections(6μm) were made and mounted on glass slides.
Following staining with Mayer's hematoxylin solution and 1% eosin alcohol solution(H&E staining), the total numbers of cystic lesions that invaded the subchondral bone plate or calcified zone were counted from 3 slides that corresponded to weight-bearing areas. Density of cystic lesions was expressed as the number of cystic lesions per 10-mm-length of specimen[10]. Correlation of parameters related to irregularity of the contour on MRI and the density of cystic lesions were examined.
Statistical analysis was performed with correlation coefficients and Mann-Whitney's U analysis, in which a p-value < 0.05 was considered to be statistically significant.
Twenty-eight females and twenty-two males were enrolled(mean age, 61.2 years; range, 46-77 years). The average body mass index(BMI) was 27.99±3.19 (mean±S.D.).
Based on entry data, correlation coefficients of WOMAC scores and the four Irregularity Index System parameters (ATC, ASTC, RUL, and SDC) were 0.209(P=0.1462), 0.275(P=0.529), 0.239(P=0.0945), and 0.327(P=0.0199), respectively. While positive correlations were observed between WOMAC score and all four parameters, only that for SDC was statistically significant(Table 1, Fig. 2).
Table 1 Correlation coefficient of four parameters and WOMAC score
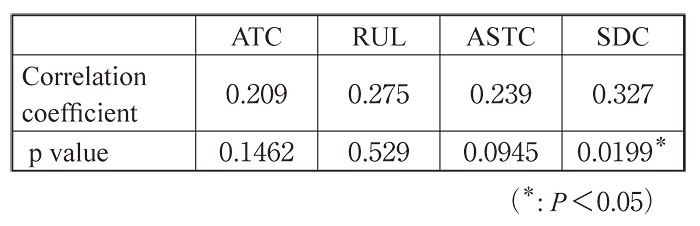
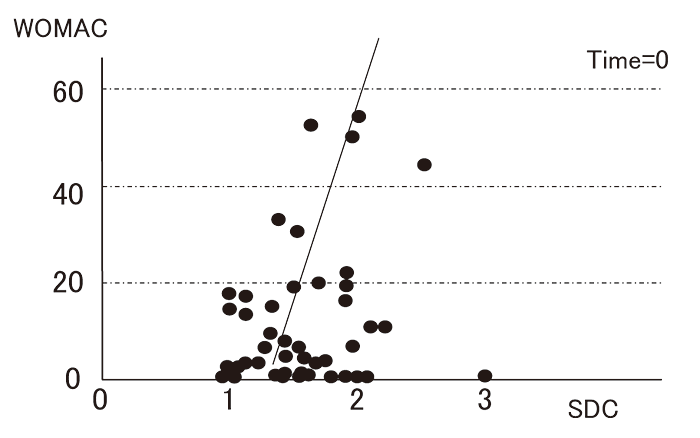
Fig. 2 Correlation between irregularity of the femoral condyle(SDC) and total WOMAC score
One of the four parameters of the Irregularity Index System, SDC, was positively correlated with total WOMAC score at study entry point(γ=0.327, P=0.0199)
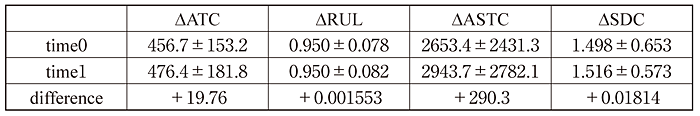
Comparison of femoral condyle irregularity between study entry and follow-up revealed that average ATC changed from 456.7±153.2(mean±S.D.) to 476.4± 181.8, average RUL changed from 0.950±0.078 to 0.951±0.082, average ASTC changed from 2653.4± 2431.3 to 2943.7±2782.1, and average SDC changed from 1.498±0.653 to 1.516±0.573(Table 2).
Table 2 Changes of four parameters over the 14 months period
Correlations between increases and decreases in femoral condyle irregularity, as measured by ΔATC, ΔRUL, ΔASTC, and ΔSDC, over 14 months and increases and decreases in WOMAC score (ΔWOMAC) over the same period were examined. Among the four parameters, only ΔSDC was correlated with ΔWOMAC (Fig. 3), with γ=0.294 (P= 0.0421). While the other three parameters exhibited positive correlation coefficients, these correlations were not statistically significant.
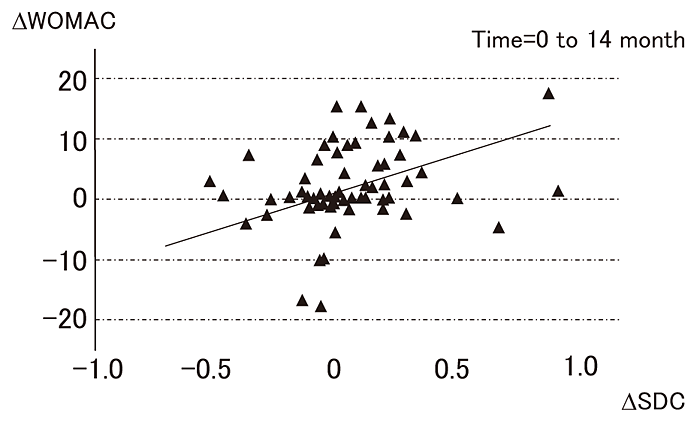
Fig. 3 Correlation between changes in irregularity of the femoral condyle(ΔSDC) and changes in total WOMAC score(ΔWOMAC)
ΔSDC was positively correlated with ΔWOMAC(γ= 0.294, P=0.0421).
No bone resorption pits was found in specimen retrieved from low SDC condyle(Fig. 4-a) whilest highly densed bone resorption pits were detected that from high SDC condyle(Fig. 4-b). SDC and number of bone resorption pits were highly correlated(Fig. 5, R=0.85, P<0.01).
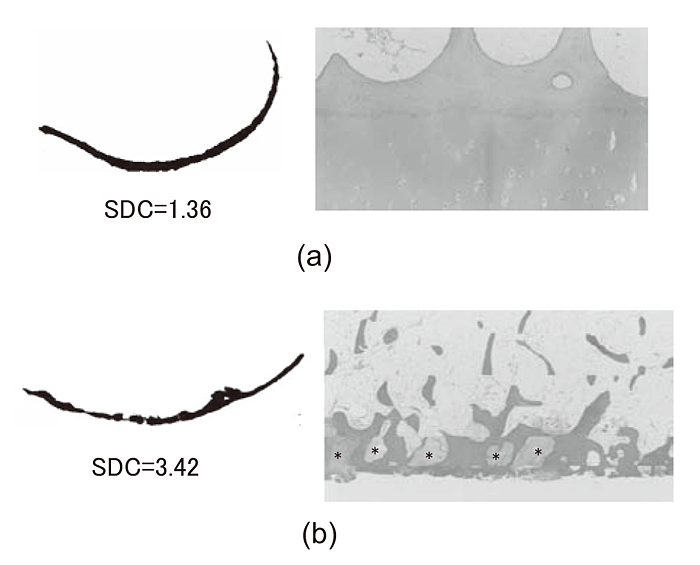
Fig. 4 SDC and histological assessment
No bone resorption pits was found in specimen retrieved from low SDC condyle(SDC=1.36) whilest highly densed bone resorption pits were detected that from high SDC condyle (SDC=3.42)(*: bone resorption pits, H & E staining).
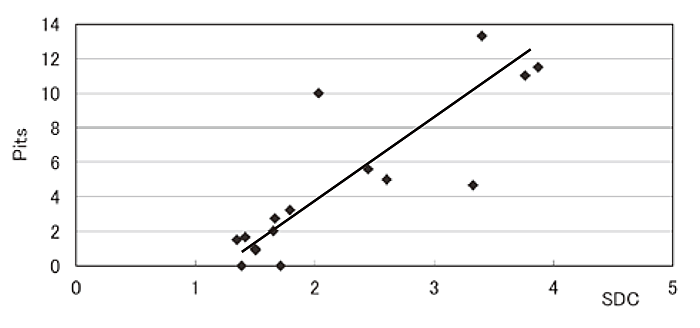
Fig. 5 SDC and density of bone resorption pits
SDC and number of bone resorption pits were highly correlated(R=0.85, P<0.01).
KOA is gaining importance in our aging society, as it is a major cause of disability in elderly individuals. Many trials for preventing or stopping the progression of KOA have been conducted[1-4,15-17]. Highly effective disease-modifying osteoarthritis drugs (DMOADs) are considered a public health necessity; therefore, establishing a monitoring system for their efficacy is mandatory.
A system that evaluates the irregularity of the contour of the femoral condyle may be effective in monitoring the objective severity of KOA. The Irregularity Index System presented in this paper appears to be such a system, as(1) SDC reflected the WOMAC score, and (2) WOMAC score changes (ΔWOMAC) were correlated with changes in femoral condyle irregularity(ΔSDC). Moreover, histological examination of specimens obtained at the time of total knee arthroplasty(TKA) revealed that the density of bone resorption pits formed at the osteochondral junction, which is an indicator of histological severity of osteoarthritic changes[18], was correlated with irregularity of the femoral condyle.
Until now, joint space measurement under fluoroscopic guidance was considered to be the gold standard for monitoring structural changes in KOA [19-20]; however, this technique is too laborious to use as a general monitoring system. While MRI-based cartilage volume measurement is promising, it is also time-consuming, and even with a 3.0-T machine and fine-tuned sequences, its accuracy error rate of 3% may not be sufficient for monitoring disease progression or cartilage therapy efficacy[6]; thus, use of this technique in clinical KOA monitoring requires further improvement. The entire Irregularity Index System procedure takes <3 minutes after acquisition of MR images. Thus, this system could be easily adopted into clinical practice in conjunction with currently used imaging modalities.
A unique aspect of the Irregularity Index System is that subchondral bone is assessed. In contrast, determination of structural changes by joint space measurement or by MRI-based volumetric assessment involves evaluation of cartilage. Joint component assessment using the Irregularity Index System appears to reflect pathological changes of subchondral bone[21-23], the degree of which may be related to knee pain or other symptoms [24-25]. Bone attrition, which strongly depends on changes in subchondral bone, is a key factor related to clinical symptoms[26]; this finding appears to be consistent with our Irregularity Index System results. In comparison to joint space measurement or
cartilage volume changes, which are not correlated with clinical symptoms[27], the Irregularity Index System measurements in this study were well correlated with WOMAC scores.
In our previous study, all four Irregularity Index System parameters relating to femoral condyle irregularity were correlated with clinical severity[13]; however, in the present study, only SDC was correlated with clinical(WOMAC) score. This difference may be largely due to the difference between patient cohorts in the two studies. In the previous study, over half of the patients in the 48-patient cohort had such severe KOA that they were awaiting TKA. In contrast, patients in the present study fulfilled OAI inclusion criteria and therefore presumably had earlier-stage KOA: 30% (n=15) of the cohort had a WOMAC score of 0, and a small proportion(~5%) even had asymptomatic knees. Considering that the contour of the femoral condyle on MRI that corresponds to subchondral bone and subchondral change occurs in the later stages of KOA, the Irregularity Index System may be more suitable for assessment of moderate-to-severe KOA. However, this system can also be used for monitoring KOA status in patients with early-stage disease, as demonstrated in the present study.
We did not use additional objective standards of reference, such as joint space narrowing or cartilage volume measurement, which could potentially detect structural progression of OA. The present study utilizes a data set that was courteously provided by OAI; joint space narrowing and cartilage volume measurement data were not available. Furthermore, the contour of the femoral condyle corresponds to subchondral bone[21-22]. The Irregularity Index System may therefore be unsuitable for detection of early osteoarthritic changes that occur in the cartilage in early-stage KOA patients [23], in whom other assessment methods would be more appropriate.
Address correspondence to Dr. Takahisa Sasho.
Department of Orthopaedic Surgery, Graduate School of Medicine,
Chiba University, 1-8-1, Inohana, Chuou-ku, Chiba, 260-8670, Japan.
Phone: +81-43-226-2117. Fax: +81-43-226-2116.
E-mail: sasho@faculty.chiba-u.jp