


Chiba Medical J. 90E:13~19,2014
doi:10.20776/S03035476-90E-4-P21
[The Chiba Medical Society Award (2013)]
Nobusada Funabashi
Department of Cardiology, Chiba University Hospital, Chiba 260-8677.
(Accepted June 13, 2014)
I went to the Stanford University Department of Radiology’s three-dimensional (3D) imaging laboratory from 1996 to 1999 to study a novel 3D image processing technique using electron beam computed tomography (CT). When I returned to Japan, I found that multi-slice CT had been available in daily practice since 1998. We have published a total of 152 peer-reviewed papers on diagnostic images in the field of cardiovascular disease. In 2003, when 16-slice CT was available for use in general hospitals, we successfully developed a prototype 256-slice cone-beam CT at the National Institute of Radiological Sciences. We produced several papers discussing the utilities of this prototype CT in both animal and phantom experiments, the concepts and ideas that were currently used for cardiac perfusion and myocardium characteristic study. In 2010, our paper was used as a reference in the American College of Cardiology Foundation Expert Consensus Guideline.
The our current topics presented include coronary artery stenosis, coronary arterial plaques, the characteristics of the myocardium, the anatomy of structural and congenital heart disease, and the cardiac function, all using 16-320 slice CT with reduced radiation exposure in CT acquisition. Furthermore, we are now performing novel clinical CT studies combined magnetic resonance imaging (MRI), positron emission tomography, and echocardiography. Using previous image data, we analyzed an epidemiology study using CT findings to predict the occurrence of major cardiovascular adverse events over long-term followup periods of more than 100 months (median), one of the longest follow-up periods documented in the literature. We also need to obtain accurate diagnoses for subjects with cardiac failure or fatal arrhythmia of unknown origin, allowing them to receive specific effective therapy for their possible cardiac amyloidosis, cardiac sarcoidosis, or Fabry’s disease. Of course, in all CT imaging techniques used for evaluation and monitoring of cardiovascular risk, we also evaluated the harmful effect of radiation exposure for image acquisition. The technology of non-invasive modalities such as CT, echocardiography, or MRI will continue to develop; their diagnostic accuracies will increase, and the dose of radiation exposure and amount of usage of contrast material by CT will decrease. Finally, I hope to use CT as screening tool for symptomatic subjects to identify the occurrence of acute coronary syndromes or fatal ventricular arrhythmia, and hope to contribute to improve their prognosis.
Computed Tomography, Improve Prognosis, Acute coronary syndrome, Coronary Arteries, and Myocardium
I went to the Stanford University Department of Radiology’s three-dimensional (3D) imaging laboratory from 1996 to 1999 to study a novel 3D image processing technique using electron beam computed tomography (CT). When I returned to Japan, I found that multi-slice CT had been available in daily practice since 1998. We have published a total of 152 peer reviewed papers concern about diagnostic images in cardiovascular field. In 2003, when 16-slice CT was available for use in general hospitals, we successfully developed a prototype 256-slice cone-beam CT at the National Institute of Radiological Sciences. We produced several papers discussing the utilities of this prototype CT in both animal and phantom experiments, the concepts and ideas that were currently used for cardiac perfusion and myocardium characteristic study.
[References 91,96,98,109,121,136]
In 2010, our paper was used as a reference in the American College of Cardiology Expert Consensus Guideline[. Reference 75]. Currently, we have published several papers and have presented data at the annual meetings of international medical societies (including the American Heart Association and American College of Cardiology). The topics presented include coronary artery stenosis, coronary arterial plaques, the anatomy of structural and congenital heart disease, the characteristics of the myocardium, and cardiac function, all using 16-320 slice CT with reduced radiation exposure in CT acquisition. Furthermore, we are now performing novel clinical CT studies combined magnetic resonance imaging (MRI), positron emission tomography, and echocardiography. Using previous image data, we analyzed an epidemiology study using CT findings to predict the occurrence of major cardiovascular adverse events over long-term follow-up periods of more than 100 months (median), one of the longest follow-up periods documented in the literature.
We introduced concretely some of those studies as follows.
To evaluate the diagnostic accuracy of 320 slice CT for detection of significant coronary artery stenosis in patients with various heart rates (HR) and heart rhythms, including tachycardia and chronic atrial fibrillation (CAF) (Figure 1) compared with ICA. 106 consecutive patients underwent both 320 slice CT and ICA within 3 months (normal sinus rhythm [NSR] 91.5%, CAF 8.5%, mean HR 65±15 beats/min (BPM)). There were no cardiac events between the 2 procedures. Patients were divided in 2 groups: Group 1 (HR<65 with NSR at CT scan, N=62), and Group 2 (HR>64 with NSR or heart rhythm irregularities at CT scan, N=44). Patients with >50% or >75% luminal stenosis on CT were compared with those with >50% or >75% stenosis on ICA, respectively. In a segment by segment analysis, in all patients, sensitivity, specificity, positive (PPV) and negative predictive value (NPV) of >50% stenosis on CT for predicting >50% stenosis on ICA were 69, 98, 78, and 97%, respectively, and those of >75% stenosis on CT for predicting >75% stenosis on ICA were 78, 98, 64, and 99%, respectively (Table 1). Sensitivity, specificity, PPV, and NPV of >50% and >75% stenosis on CT for predicting >50% and >75% stenosis, respectively, on ICA were comparable. Diagnostic accuracy was essentially the same in both groups. 320 slice CT had high diagnostic accuracy for the detection of significant coronary artery stenosis compared with ICA. Even though the numbers were small, patients with high HR or heart rhythm irregularities might have essentially equivalent results to those with low HR with NSR.
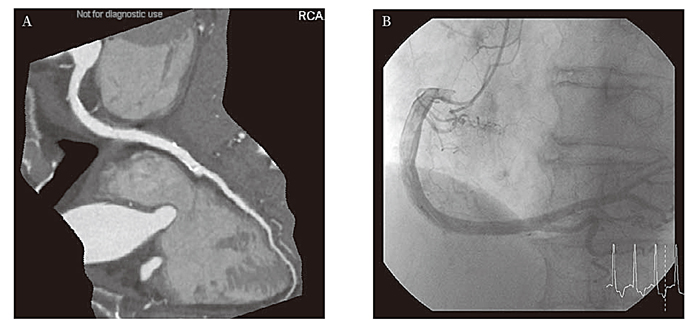
Fig.1 Typical Images Acquired with 320 Slice Computed Tomography (CT) and by Invasive Coronary Angiography (ICA) of a Patient with Chronic Atrial Fibrillation (CAF)(. Modified from Reference 39).
A: Typical Image of Coronary Arteries using Enhance 320 Slice CT.
Curved planar reformation image of the right coronary artery (RCA).
After acquiring plural heart beat data, the longest R-to-R interval data was manually selected and data were reconstructed by half reconstruction.
Even though this patient had CAF, there are no banding artifacts and image quality was excellent. There was no significant stenosis in any of the vessels on CT.
B: Images of ICA of the RCA, Acquired from the Same Patient as in Figure 1A.
There was also no significant stenosis found on ICA as seen on CT images shown in Figure 1A.
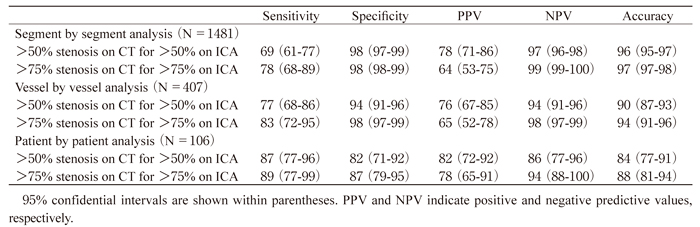
Table 1
Diagnostic Accuracy of 320 Slice Computed Tomography (CT) for >50% and >75% Luminal Stenosis on a Segment by Segment, Vessel by Vessel, and Patient by Patient Analysis for Predicting Significant Coronary Artery Stenosis of >50% and >75%, Respectively, on Invasive Coronary Angiography (ICA) in All 106 Patients (Modified from Reference 39).
To investigate clinical significance of false positive (FP) findings on 320 slice CT compared with ICA for detecting coronary arterial stenosis, we followed patients with FP findings for occurrence of major adverse cardiovascular events (MACE). 153 patients (107 male, 65±12 years) undergoing retrospective ECG gated 320 slice CT and ICA within 3 months without incident were retrospectively analyzed. We used two diagnostic criteria, >50% and >75% stenosis, for both modalities, and followed FP and true negative (TN) patients for a median of 20 months. There were 12 FP and 59 TN patients for >50% criterion and 14 FP and 84 TN patients for >75% criterion. Reasons for FP were blooming artifact from heavy calcifications, non-calcified plaques with outward remodeling, and poor image due to tachycardia. During the observation period, 1 and 3 patients showed MACE in the FP and TN groups, respectively, for >50% criterion, and 5 and 7 patients showed MACE in the FP and TN groups, respectively, for >75% criterion. Significant differences in occurrence of MACE between FP and TN groups for >75% criterion were observed on Kaplan Meier analysis and log rank test (P=0.015) (Figure 2). The most frequent-reason for FP findings of CT in comparison with ICA for >75% criterion coronary arterial stenosis was the blooming artifact due to heavy calcifications (71%) (Table 2). Prognosis for the FP group was significantly poorer than TN group, especially when FP occurred due to blooming artifact from heavy calcifications.
Fig.2
Kaplan Meier Survival Curves for the Occurrence of Major Adverse Cardiovascular Events (MACE) between Patients with True Negative and False Positive Findings for Detecting Coronary Arterial Stenosis by Computed Tomography (CT) in Comparison with Invasive Coronary Angiography (ICA) for the >75% Stenosis Criterion (Modified from Reference 39).
During a median of 20 months follow-up period, the occurrence of MACE was significantly higher in subjects with false positive findings than in those with true negative findings for the >75% stenosis criterion (P=0.015, logrank test)
Table 2
Reasons for False Positive Computed Tomography (CT) Findings in Detecting Coronary Arterial Stenosis for >50% and >75% Stenosis Criteria in Comparison with Corresponding Criterion on Invasive Coronary Angiography (ICA) in a Patient by Patient Analysis (Modified from Reference 39)
To evaluate significance of presence of three vulnerable plaque characteristics (VPC) co-existing in single non calcified plaques (NCP) or mixed plaques (MP) in non obstructed coronary arteries on CT: 1) low attenuation (LA) (<30HU), 2) positive remodeling (PR) and 3) spotty calcification (SC) (Figure 3), for the risk of MACE. 166 consecutive subjects with suspected coronary artery disease (81 male; 62± 13 years; hypertension, 61%; diabetes mellitus, 21%; dyslipidemia, 56%; smokers, 45%; obese, 49%) underwent cardiac CT from 2003 to 2004. On CT no significant stenosis (≤ 50%) of coronary arteries was observed; subjects were retrospectively followed for a median of 103 months after CT and incidence of MACE was compared. Subjects with old myocardial infarction or myocardial diseases were excluded from the analysis. MACE included cardiac death, acute coronary syndromes, new onset of angina pectoris, and cardiac failure. 39 subjects had NCP (17) or MP (22), of whom 8, 29, and 14 subjects had LA, PR, and SC in NCP or MP, respectively. These were classified into 4 groups, 1) 128 who did not have NCP or MP with any VPCs, 2) 20 who had NCP or MP with one VPC, 3) 14 who had NCP or MP with two VPCs and 4) 2 who had NCP or MP with three VPCs. 6 subjects (4%) had MACE. Subjects who had NCP or MP with ≥ two VPCs (N=16) had a higher risk of MACE than subjects with ≤ one VPC (N=150) (P<0.05) during the observation period. Significant differences between subjects with NCP or MP with ≥ two VPCs and others (zero, one VPC groups) were observed at each time point when the whole period of follow-up was compared by Kaplan Meier analysis and log rank test (P<0.001) (Figure 4). A Cox proportional hazard model revealed that presence of NCP or MP with ≥ two VPCs on coronary arteries on CT was a greater predictor of MACE (Hazard ratio 7.5, 95% confidential interval 1.0-55.4, P<0.05) than other factors. Presence of NCP or MP with ≥ two VPCs in non obstructed coronary arteries on CT were critical factors for the prediction of MACE in subjects with normal myocardium on followup for a median of 103 months. Even in subjects without significant stenosis in coronary arteries on CT, if NCP or MP with ≥ two VPCs are observed on CT, careful follow-up with control of risk factors is desired.

Fig.3
Definition of Vulnerable Plaque Characteristics.
Fig.4
Kaplan-Meier Survival Curves for ≥ 2 Vulnerable Plaque Components (VPCs) Observed in a Single Non Calcified Plaque (NCP) or Mixed Plaque (MP) Simultaneously for Occurrence of MACE.
Significant differences between the subjects who had a single NCP or MP with ≥ 2 VPCs simultaneously and those who did not have a single NCP or MP with ≤ 1 VPC were seen at each time point and when the whole period of follow up was compared with a Kaplan Meier analysis and log rank tes(t P<0.001)
To reduce radiation exposure, prospective ECG gating without padding is preferable. To evaluate diagnostic accuracy of coronary 320 slice CT angiography using various acquisition methods, we compared retrospective ECG gated with dose modulation and“ virtual” prospective ECG gating with and without padding. We retrospective selected 77 consecutive symptomatic subjects (52 males, 62±12 years) with normal sinus rhythm who underwent both retrospective ECG gated 320 slice CT and ICA within 3 months. CT images were reconstructed at 5% from 0 to 95% of RR interval. Three methods were used to assess >50% coronary stenosis; 1) using only 75% of data named virtual prospective ECG gating without padding, 2) using 70-100% of data if HR was <66 BPM, or using 35-100% of data if HR was >65 BPM, named virtual prospective ECG gating with padding, and 3) using all phase data named retrospective ECG gating. In 42-subjects with HR<66 BPM, there were zero unevaluable segments in virtual prospective ECG gating with and without padding and retrospective ECG gating. But in 35 subjects with HR>65 BPM, the percentage of unevaluable segments was significantly higher in virtual prospective ECG gating without padding (13.6± 27.9%) than in virtual prospective ECG gating with padding (0.7±3.1%), and retrospective ECG gating (0.7±3.1%) (both P=0.012) (Figure 5). Using only evaluable-lesions, in 35 subjects with HR>65 BPM, sensitivity, specificity, PPV and NPV of CT for detecting >50% luminal stenosis compared with ICA were 82%, 94%, 60%, and 98%, respectively, for virtual prospective ECG gating without padding, 97%, 96%, 73%, and 100%, respectively, for virtual prospective ECG gating with padding, and 97%, 96%, 73%, and 100%, respectively, for retrospective ECG gating (all P=not significant). Virtual prospective ECG gating at 75% of RR-interval without padding had significantly more unevaluable segments than virtual prospective ECG gating with padding and retrospective ECG gating only in subjects with HR>65 BPM.
Fig.5 Frequency of Unevaluable Segments of Coronary Arteries on Computed Tomography (CT) Among Three Electrocardiogram (ECG)-gating Methods (Modified from Reference 28).
In 35 subjects with heart rate (HR) >65 beats per minute, the percentage of unevaluable segments of coronary arteries among a total of 560 segments on CT were significantly higher in virtual prospective ECG gating without padding (13.6±27.9%) than in virtual prospective ECG gating with padding (0.7±3.1%), and retrospective ECG gating (0.7±3.1%) (both P=0.012).
If specific organized substrates of ventricular fibrillation (VF) are identified, they may provide important information for prevention of sudden cardiac death. To identify specific organized substrates of VF, we compared 320 slice CT heart images in non ischemic VF subjects with non ischemic sustained and non sustained ventricular tachycardia (VT) subjects. Retrospective analysis of a total of 103 subjects who had VF (17 subjects; age, 59±16 years), sustained VT (20 subjects; 62±19 years), or non-sustained VT (66 subjects; 60±15 years) underwent 320 slice CT. After excluding 26 ischemic subjects with >50% stenosis in any coronary arteries on CT, myocardial infarction, or coronary vasospastic angina, a total of 77 non ischemic subjects (12 VF subjects; age, 58±18 years), (13 sustained VT subjects; 55±20 years) or (52 non sustained VT subjects; 58±15 years) were analyzed. On CT, myocardial abnormal late enhancement (Figure 6) was significantly more frequent in the VF group (75%, all myocardial abnormal late enhancement in left ventricle) than in the sustained VT group (31%) and the non sustained VT group (35%) (both P<0.01) (Figure 7). Myocardial fatty change was significantly more frequent in the sustained VT group (54%) than in the VF group (17%) and the non sustained VT group (12%) (both P<0.01). Final diagnoses of the non ischemic VF and sustained groups included four subjects in each case with normal cardiac structure on transthoracic echocardiogram; the former included two subjects who had abnormal late enhancement on CT without specific ECG findings. Myocardial abnormal late enhancement and fatty change on CT may be substrates of VF or sustained VT in non ischemic subjects. 320 slice CT can evaluate both coronary arteries and myocardium.
Fig.6
Typical 320 Slice Computed Tomographic (CT) Images of Myocardial Abnormal Late Enhancemen(t Modified from Reference 35)
Fig.7
Comparison of Frequency of Myocardial Abnormal Late Enhancement and Fatty Change on 320 Slice Computed Tomography (CT) among The Three“ Non Ischemic” Arrhythmia Groups (Ventricular Fibrillation (VF), Sustained and Non Sustained Ventricular Tachycardia (VT)) (Modified from Reference 35).
The frequency of myocardial abnormal late enhancement on CT was significantly higher in the non ischemic VF group (75%, all myocardial abnormal late enhancement was in the left ventricular myocardium) than in the non ischemic sustained VT group (31%) and the non ischemic non sustained VT group (35%) (both P<0.01). The frequency of myocardial fatty change on CT was significantly higher in the non ischemic sustained VT group (54%) than in the non ischemic VF group (17%) and the non ischemic non sustained VT group (12%) (both P<0.01).
We evaluated the clinical significance of fat infiltration in the moderator band (MB) of the right ventricle (RV) and in the RV myocardium (RVM) (Figure 8) and its association with conduction abnormalities in the electrocardiogram. 132 subjects (58 male; age 59±27 years) with no findings of organicdisease (all right and left side hearts were normal) undergoing ECG gated non contrast multislice CT were retrospectively analyzed for the presence of fat infiltrating the MB or RVM. MB fat infiltration was detected in 42 subjects, but these individuals showed no significant differences in the incidence of right bundle branch block, mean QRS width or standard-deviation of the QRS axis, which would have suggested the presence of hemi left bundle branch block. Only age (64.3 vs 57.9 years, P=0.025) was significantly different in subjects with MB fat infiltration. But logistic regression showed none of the factor associated with increased presence of MB fat infiltration. RVM fat infiltration was detected in 35 subjects, again with no significant differences in the incidence of right bundle branch block, QRS width or standard-deviation of the QRS axis. Only age (65.9 vs 57.8 years, P=0.001) and gender (71% vs 51% female, P=0.033) were significantly different in subjects with RVM fat infiltration. Logistic regression showed age (Odd ratio=1.05 and 95% CI =1.01~1.08 P=0.008) and female sex (Odd ratio =2.44 and 95% CI=1.03~5.88; P=0.043) were associated with increased RV fat infiltration (Table 3). MB or RVM fat infiltration seen on CT may not indicate organized abnormal myocardial conduction, but RVM fat infiltration may indicate only degeneration due to aging, especially in females.
Fig.8
Typical Non Enhanced Computed Tomographic (CT) Image of Fat Infiltration in the Anterior Free wall in the Right Ventricle (RV) Myocardium (Modified from Reference 36)
Left sagittal image.
A low CT area can be seen in the anterior free wall in RV myocardium.
The average CT value was -49HU.
Table 3
A Logistic Regression Model Taking the Presence of Fat Infiltration in the Right Ventricle Myocardium as the Dependent Variable, and Age, Female Sex, Hypertension, Diabetes Mellitus and Hyperlipidemia as the Predictor Variables (Modified from Reference 36).
Our final purpose in using CT data is to establish a new preventive medical system to improve patient prognosis. To achieve this purpose, we have to be able to predict future occurrence of acute coronary syndromes, such as acute myocardial infarction and unstable angina pectoris (with fatality rates of approximately 30-40%), in symptomatic patients. We also need to obtain accurate diagnoses for subjects with cardiac failure or fatal arrhythmia of unknown origin, allowing them to receive specific effective therapy for their possible cardiac amyloidosis, cardiac sarcoidosis, or Fabry’s disease.
We must first accurately identify patients with asymptomatic coronary artery disease using CT, finding those who have coronary arterial plaques in which vulnerable components such as positive remodeling, low CT attenuation, and spotty calcification exist, but luminal stenosis is absent. Next, we have to confirm through large-scale, long-term prospective epidemiology study whether these patients would actually experience acute coronary syndrome. And finally, when we find these vulnerable patients, we need to identify what procedures will improve their future prognosis; these procedures could include modification of coronary risk factors, prescription of low-dose aspirin, statin, or beta blocker, or even percutaneous coronary intervention as the preventive therapy.
For myocardial disease with fatal ventricular arrhythmia, we speculated that presence of myocardial fibrosis detected by CT or MRI may have a relationship with the occurrence of fatal ventricular arrhythmia. If we detect myocardial fibrosis, we have advocated that we should be concerned about possible fatal ventricular arrhythmia, evaluating the patients with 24-hour monitored or Holter electrocardiography.
Of course, in all CT imaging techniques used for evaluation and monitoring of cardiovascular risk, we should be aware of the harmful effect of radiation exposure and renal dysfunction due to use of contrast materials for image acquisition. We must weigh the merits of cardiac CT acquisition to detect vulnerable or symptomatic patients, or myocardial fibrosis; if preventive therapy is useful in producing reliable evidence of disease, the merits will overcome the risk of radiation exposure and possible reactions to contrast material.
The technology of non-invasive modalities such as CT, echocardiography, or MRI will continue to develop; their diagnostic accuracies will increase, and the dose of radiation exposure and amount of usage of contrast material by CT will decrease.
Finally, I hope to use CT as screening tool for symptomatic subjects to identify the occurrence of acute coronary syndromes or fatal ventricular arrhythmia, and hope to contribute to improve their prognosis. Furthermore, as a result of improved prognosis using this technology, we may be able to reduce medical expenses worldwide.
I thank my collaborators, Masae Uehara, Hiroyuki Takaoka, Akihisa Kataoka, Koya Ozawa, Toshioh Fujibuchi, Naoko Mizuno, Nobuyuki Komiyama, Katsuya Yoshida, Issei Komuro, Geoffrey D Rubin and Yoshio Kobayashi.
Address correspondence to Dr. Nobusada Funabashi.
Department of Cardiology, Chiba University Hospital, 1-8-1
Inohana Chuou-ku, Chiba 260-8677, Japan.
Phone: +81-43-222-7171. EXT: 5264.
E-mail: nobusada@w8.dion.ne.jp