


Volume 84, Number 1
doi:10.20776/S03035476-84-1-P19
[Original Paper]
Shinji Kondo1, 2), Ichiro Shimoyama1), Akio Yoshida1), Hidekiyo Yoshizaki1)
Fumiaki Hayashi1), Keiichi Nagao1, 3) and Shigeto Oda1, 4)
(Received July 12, 2007, Accepted August 29, 2007)
Photoplethysmographic estimation for blood pressure is proposed for a minimal invasive monitoring. Photoplethysmography was applied for pipe flow in a viscous fluid. The algorism is to estimate systolic and diastolic pressures based on a correlation to photoplethysmographic information, calibrated with the oscillometric pressures. Simultaneous recording with the estimation and the servo-plethysmo- manometry with Finapres® was done for 1 volunteer, and the intra-arterial monitoring was done for the other volunteer. Coefficient of correlation was 0.45 for the systolic pressures between the estimation and Finapres®, and that was 0.56 for the diastolic pressures between them. Coefficient of correlation was 0.90 for the systolic pressures between the estimation and the intra-arterial monitoring, and 0.83 for the diastolic pressures between them. Conclusively, this method might provide us moderate coincidence among the arterial-, digital- and earlobe-blood pressures. The intra-arterial pressure is for an artery, and Riva-Rocci/Korotkoff technique or oscillometric BP are also for the artery just below the cuff applied. This photoplethysmography might estimate integrated hemoglobin dynamics among arteries, veins and capillaries. The different tissues to measure and different modality to sense might make those differences. However, this simple estimation should prepare certain circulatory information for us with minimal risk.
blood pressure, noninvasive continuous monitoring, photoelectric estimation, plethysmogram
A mercury sphygmomanometer with a stethoscope had been a gold standard to measure the arterial blood pressure (BP), but has been disappearing [1], because of not only the ecological pollution of mercury but also the reliability of the audible sound even after complete deflation of the cuff, or the auscultatory gap [2]. An aneroid sphygmomanometer and oscillometric technique had been reported [3]. Continuous monitoring had been reported as the tonometric method [4] and the finger cuff servo-plethysmo-manometry [5], and the direct intra-arterial method [6]. The finger cuff method (Finapres®, Ohmeda, USA) is less invasive than the intra-arterial method, but venous congestion might sometime worry patients because of the counter pressure applied. Continuous BP monitoring is important for critical patients because unexpected hypotension could induce serious outcomes of renal, cardiac or cerebral functions, especially for aged patients. Arterial direct puncture for pressure monitoring with a catheter is reliable and frequently used in the intensive care units. But, the direct method is invasive and makes patients some restraint, and accidental bleeding or infection was major complications. Non-invasive and continuous monitoring of BP is an ideal for both patients and doctors, therefore, minimal invasive method to estimate BP was proposed applying with a photoplethysmogram [7] in this study.
Two male volunteers, aged 52 and 55 years, had participated in this study after full explanation of this study and gave informed consent to this study. This study had been agreed with the committee on human ethics of the institution. One was for the BP recording with Finapres® at the middle finger and the photoplethysmographic estimation at the little finger and the earlobe, and the other was for the direct intra-arterial recording at the radial artery and the estimation at the little finger.
1) Photoplethysmography was applied for pipe flow in a viscous fluid (Hagen-Poiseuille flow [8]). The algorism of Hagen-Poiseuille flow follows an equation below,
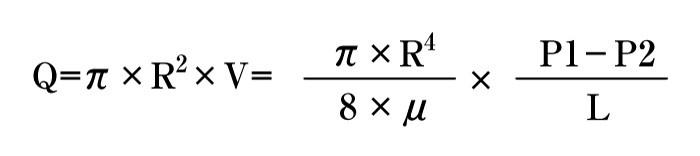
In short, pressure correlates flow volume in a pipe. Above law was applied for the photoplethysmography.
Premises were below used in the logic to estimate,
Therefore, when adequate pressure and adequate emitting light were applied to the tissue, the transmitted light was hypothesized to correlate to the blood pressure, i. e., the systolic pressure was estimated for the peak of the light transmitted, and the diastolic pressure was estimated for the volley of the light transmitted.
Figure 1-a showed a schema of the BP pulsation and time course.
Equations below were hypothesized for BP (Fig. 1-a).
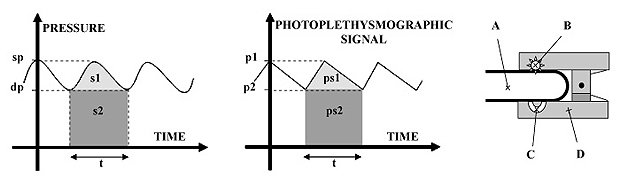
Fig. 1
Upper figure (1-a); A schema of the BP pulsation and time course. The ordinate represents pressure in mmHg, and the abscissa represents time course. t: the interval for one pulse.
Middle figure (1-b); A schema of the photoplethysmographic pulsation and time course. The ordinate represents transmitted light signals, and the abscissa represents time course. t: the interval for one pulse.
Lower figure (1-c); A probe applied to the tissue, which was composed of a clipping applier like as a forceps for a finger or an earlobe, a red photo-emitter (644 nm) and a photo-receiver. A: finger or earlobe, B: light emitting diode, C: photodiode, D: A probe to clip the tissue.
Figure 1-b showed a schema of the photoplethysmographic pulsation and time course. Then, equations below were hypothesized for photoplethysmographic pulsation (Fig. 1-b).
When K was hypothesized to be pK, equations below were deduced.
Therefore, p1 and p2 was estimated as systolic and diastolic pressures [9-12].
Figure 2 showed a flow chart of this study [9-12], the beginning was to inflate a cuff over an elbow, and systolic and diastolic pressures were measured in the oscillometric method. And integrated BP was estimated as for one pulse. The photoplethysmographic signals were adjusted to appropriate working range, and integrated photoplethysmographic signals were estimated as for one pulse. The integrated photoplethysmographic signals correlated to the integrated BP, i. e., systolic and diastolic pressure were estimated from the photoplethysmographic signals.
The dynamics of the light transmission by tissues was measured at 644 nm.
Figure 1-c showed a probe applied, which was composed of a clipping applier like as a forceps for a finger or an earlobe, a red photo-emitter and a photo-receiver.
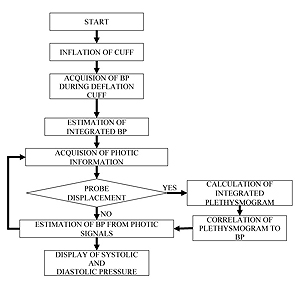
Fig. 2
Flow chart to estimate continuous blood pressures with the photoplethysmogram.
Photoplethysmographic estimation over the radial artery, the little finger, and the earlobe was done and simultaneous recording was done with Finapres® at the middle finger. The other recording was done with the estimation over the right radial artery, and simultaneous recording with the intra-arterial monitor was done for the left radial artery. Coefficient of correlation was calculated with MatLab® (The MathWorks, USA).
Figure 3-a showed simultaneous BP recording during 10 sec with the photoplethysmographic estimation and with Finapres®; the dotted plot represented BP for Finapres® over the middle finger and the thick plot represented BP estimated with the photoplethysmogram over the radial artery and the thin plot represented BP for the little finger. Each systolic or diastolic pressure showed different phase for every beats. Mean systolic pressure was 118.3 (standard deviation; 1.09) mmHg with the estimation over the radial artery, 105.9 (1.06) mmHg with the estimation over the little finger, and 123.5 (1.73) mmHg with Finapres® over the middle finger. Mean diastolic pressure was 79.1 (0.67) mmHg with the estimation over the radial artery, 70.1 (1.3) mmHg with the estimation over the little finger, and 77.8 (1.27) mmHg with Finapres® over the middle finger (Table 1).
Table 1
Mean systolic (SYSTOLE) and diastolic pressures (DIASTOLE) in mmHg and their standard deviations in the parentheses. P-RADIAL; estimated pressure over the radial artery, P-FINGER; estimated pressure over the little finger, F-FINGER; BP with Finapres®. *: P<0.01, np: no significance
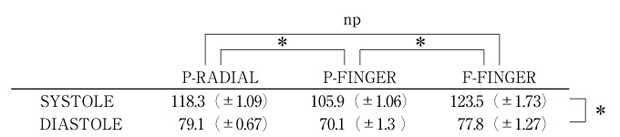
Figure 3-a showed the whole signals during simultaneous monitoring for 10 sec with the photoplethysmograhic estimation over the radial artery and the little finger, and Finapres® over the middle finger. Table 1 showed a summary of each systolic and diastolic pressure. The respective systolic and diastolic pressures were significant different (analysis of variance P<0.01). Significant differences were noted between the BP estimated for the finger and the radial artery (P<0.01), and significant difference was noted between the BP estimation over the little finger and Finapres® (P<0.01).
Figure 3-b showed the systolic and diastolic pressures during simultaneous BP recording with FinapresR and the photoplethysmographic estimation during 15 min sitting at rest and the Valsalva maneuver (VM). BP was measured every 10 sec over the left middle finger for Finapres® and over the right radial wrist for the estimation. Coefficient of correlation was 0.45 between the systolic pressures estimated by this method and those with Finapres®. Coefficient of correlation was 0.56 between the diastolic pressures estimated with this method and those with Finapres®.
Figure 3-c showed simultaneous recording of the intra-arterial BP at the left radial artery and the photoplethysmographic estimation over the right radial artery every 1 min during 30 min. Coefficient of correlation was 0.90 between the systolic pressures with the intra-arterial pressures (A-SYSTOLE) and with the estimation (P-SYSTOLE). The coefficient was 0.83 between the diastolic pressures with the intra-arterial pressures (A-DIASTOLE) and with the estimation (P-DIASTOLE).
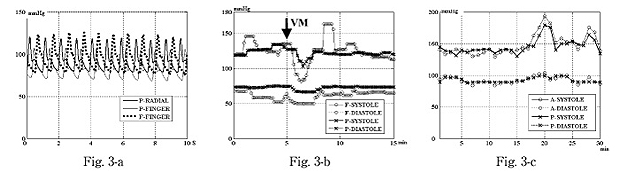
Fig. 3
Upper figure (3-a); BP estimated over the left radial artery (thick plot), BP estimated over the left little finger (thin plot), BP with Finapres® at the left middle finger, during 10 sec. The ordinate represents BP in mmHg, and the abscissa represents time course in sec.
Middle figure (3-b); BP every 10 sec during 15 min. Valsalva maneuver for 10 sec was asked in the record (VM). F-SYTOLE represents the systolic pressures with Finapres®, F-DIASTOLE represents the diastolic pressures with Finapres® at the left middle finger. P-SYTOLE represents the systolic pressures estimated with the photoplethysmogram, P-DIASTOLE represents the diastolic pressures with the photoplethysmogram at the right radial artery. The ordinate represents BP in mmHg, and the abscissa represents time course in min.
Lower figure (3-c); BP were displayed every 1 min during 30 min.
A-SYTOLE represents the systolic pressures with the intra-arterial monitor, A-DIASTOLE represents the diastolic pressures with the intra-arterial monitor at the left radial artery.
P-SYTOLE represents the systolic pressures estimated with the photoplethysmogram, P-DIASTOLE represents the diastolic pressures with with the photoplethysmogram at the right radial artery.
The ordinate represents BP in mmHg, and the abscissa represents time course in min.
This photoplethysmographic estimation did not just coincide with the intra-arterial BP, nor to the BP with Finapres®. Classic idea of BP was measured for the arteries, i. e., BP with Riva-Rocci/Korotkoff or oscillometric technique represents arterial pressure for the brachial or radial artery, just below the cuff applied. Those auscultatory methods measure the sound or oscillation generated from the artery. Arterial pressure itself was to measure for the method with an intra-arterial catheter. But the digital BP with Finapres® measures the counter pressure to cancel the photoplethysmographic signals out, so the arteries, veins and capillaries were all responsible. The photoplethysmographic estimation might be also responsible to the integrated hemoglobin dynamics. The earlobe BP with the photoplethysmographic estimation was responsible mainly to the capillaries, therefore, the estimated BP were theoretically different from the direct arterial BP and from those with Riva-Rocci/Korotkoff or oscillometric technique, which represented BP just below the cuff applied. The sound generated from the artery is unique parameter in Riva-Rocci/Korotkoff technique, and the oscillometric method. The auscultatory method of those techniques had been a basic method to measure intermittent arterial blood pressure, but has been questioned for the variety between measurements [2], and moreover, pressure for artery is gradually decreasing as for peripheral small vessels [13].
The servo-plethysmo-manometry (Finapres®) had been reported as a method for noninvasive, continuous, true-phase measurement of the finger arterial pressure [5, 15]. Kermode et al. and Molhoek et al. had reported the BP differences measured with FinapresR and with intra-arterial monitor [16, 17]. The BP with Finapres® is integrated BP both as for the finger artery and vein and as for the capillary hemoglobin dynamics. Classic idea of BP was for arterial, but nowadays, so many sophisticated photoelectric apparatus was available, tissue hemoglobin dynamics might prepare alternative precise information for respiratory and circulatory pathogenesis. Plethysmogram provides us the volume differences of the measuring part of the body, which are the sum of arteries, capillaries and veins. The photoplethysmographic method is thought to suffer from hemoglobin dynamics, so the general hemoglobin dynamics in the arteries, capillaries and veins was responsive. History of the plethysmography had shown certain validity to evaluate cardiovascular physiology [14]. Photoelectric plethysmography had been reported to well reflect the directly measured plethysmographic waves [7].
This method might provide us any other part of the body to apply than a finger-tip or a wrist, which could be lucent to the light. An earlobe is proposed for another candidate to monitor.
The peaks and volleys of the signals were different between the direct arterial BP and BP estimated with this method. The dynamics of the direct arterial pressure is correct, and those estimated with this method was not accurate phenomena. The delay originated from the redundant computation to check motion artifact before displaying BP, but this will be solved in the near future.
Conclusively, this photoplethysmograhic estimation will provide us moderate correlation among the direct intra-arterial and FinapresR monitoring.
連続血圧モニターは重症患者に必須で血圧低下を適切に診断することは重症患者の予後まで左右する。動脈穿刺と留置カテーテルによるAラインがもっとも信頼され集中治療管理では主流であるが, 血管穿刺手技・疼痛・感染の危険性・コネクターからの漏出事故などの注意を要する。連続血圧モニターの侵襲を極力すくなくするために, 光電容積脈波からの連続血圧推測アルゴリズムを提案する。カフと聴診器による伝統的なRiva-Rocci/Korotkoff法からオシロメトリック法の普及, さらには指尖に装着するFinapres®の出現によりAラインの合併症からかなり開放されたが, 指尖遠位部のうっ血の問題がのこり連続30分が限度とされる。倫理委員会ならびに2協力者からの研究同意承諾後, Finapres®と光電容積脈波からの血圧連続推定の同時計測1名, 橈骨動脈Aラインと他側の橈骨動脈光電容積脈波推定の同時計測1名施行した。Finapres®と光電容積脈波推定との収縮期圧の相関係数は0.45, 拡張期圧の相関係数は0.56であり, 橈骨Aラインと他側橈骨光電容積脈波推定では収縮期圧相関係数0.90, 拡張期圧0.83であった。Aライン法ならびにカフによる血圧測定はその部分の動脈圧を示すが, Finapres®も光電容積脈波を利用しているために100%動脈圧を反映していない。本法も光電容積脈波をオシロメトリックによる血圧から推定のためプローベにおける透過光すべてを反映するため毛細血管におけるヘモグロビン動態も反映される。これらを考慮すると計測する組織に特化した値と限定されるが呼吸循環機能を反映した1計測法として提案する。
1) Research Center for Frontier Medical Engineering, Chiba University, Chiba 263-8522.
2) K&S Co., Ltd, Aichi 448-0001.
3) Safety and Health Organization, Chiba University, Chiba 263-8522.
4) Department of Emergency and Critical Care Medicine, Graduate School of Medicine, Chiba University, Chiba 260-8670.
近藤針次1, 2), 下山一郎1), 吉田明夫1), 吉崎英清1), 林 文明1), 長尾啓一1, 3), 織田成人1, 4): 光電容積脈波による連続血圧モニター.
1) 千葉大学フロンティアメディカル工学研究開発センター, 2) 株式会社ケーアンドエス
3) 千葉大学総合安全衛生管理機構, 4) 千葉大学医学研究院救急集中治療医学
Tel. 0566-35-0647. Fax. 0566-35-0649. E-mail: kands@katch.ne.jp
2007年7月12日受付, 2007年8月29日受理.