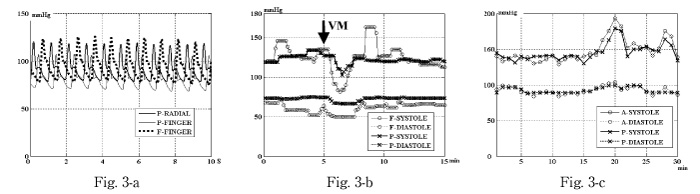
Fig. 3
Upper figure (3-a); BP estimated over the left radial artery (thick plot), BP estimated over the left little finger (thin plot), BP with Finapres® at the left middle finger, during 10 sec. The ordinate represents BP in mmHg, and the abscissa represents time course in sec.
Middle figure (3-b); BP every 10 sec during 15 min. Valsalva maneuver for 10 sec was asked in the record (VM). F-SYTOLE represents the systolic pressures with Finapres®, F-DIASTOLE represents the diastolic pressures with Finapres® at the left middle finger. P-SYTOLE represents the systolic pressures estimated with the photoplethysmogram, P-DIASTOLE represents the diastolic pressures with the photoplethysmogram at the right radial artery. The ordinate represents BP in mmHg, and the abscissa represents time course in min.
Lower figure (3-c); BP were displayed every 1 min during 30 min.
A-SYTOLE represents the systolic pressures with the intra-arterial monitor, A-DIASTOLE represents the diastolic pressures with the intra-arterial monitor at the left radial artery.
P-SYTOLE represents the systolic pressures estimated with the photoplethysmogram, P-DIASTOLE represents the diastolic pressures with with the photoplethysmogram at the right radial artery.
The ordinate represents BP in mmHg, and the abscissa represents time course in min.