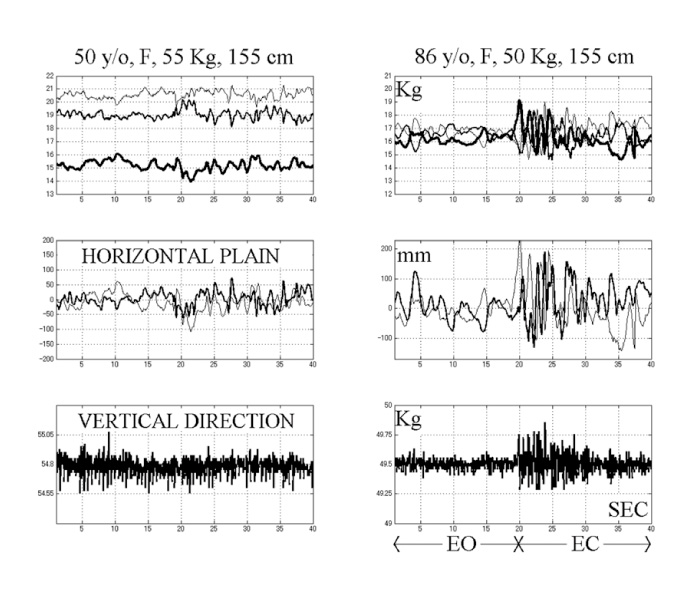
Fig. 2
COP-oscillations of the 2 subjects from the 3 load cells (2 upper graphs), M-L oscillation (thick trace) and A-P oscillation (thin trace) for the middle 2 graphs, and the vertical oscillation for the lower graphs. The abscissa represented the time course in second, the anterior half for the oscillation with eyes open and the posterior half for the oscillation with eyes closed. EO: with eyes open, EC: eyes closed.