


Volume 85, Number 4
doi:10.20776/S03035476-85-4-P177
[Original Paper]
Yasufumi Kasagi1,2), Ichiro Shimoyama1), Susumu Yoshida1,2),
Ken Nakazawa2) and Toshio Fukutake3)
(Received December 4, 2008, Accepted April 13, 2009)
The risk to fall has clinical relevance in prognosis of elderly people. We analyzed aging effects on the physiological properties of the vertical ground reaction force of healthy subjects and examined whether it can be used as an index for postural instability and risk to fall.
We analyzed stabilometric data from 1795 healthy volunteers (3 - 93 years old). Vertical acceleration was computed from the load-cell records and underwent frequency analysis. The multiple comparison test was performed by age groups at every frequency within the detected significant band.
Variances in vertical acceleration were high in juveniles and elderly people. Both acceleration power at 1.5-2 Hz and power ratio of eye closure to the open eye at 2-6 Hz were markedly high and decreased by 20 years of age. Age groups from 20 to 60 years had low stable power profiles and the age groups over 60 years showed increased power at 5-8 Hz relative to aging.
Our findings suggest that the postural instability of young people evoked by eye-closure accounts for 3-Hz vibration and that increased power in elderly subjects around 6.5 Hz has a strong correlation with aging.
vertical ground reaction force, aging, postural stability, stabilometry, spectra analysis
Prevention of fall-related injuries is a major and urgent clinical problems related to functional ability and quality of life of elderly people[1-5] . Although various neurological diseases have already been identified as major risk factors of falling[5,6], other risks prevailing among the subclinical population, including increased age, disturbed gait, or poor balance, also need to properly evaluated[2,5]. Non-invasive, non-expensive and easy-to-use method to monitor the daily changes of functional abilities to control posture will play a complementary role in improving clinical diagnosis for risk to fall. The displacement of the center of foot pressure (COP) measured by stabilometry is one method already being used[7-10], but its detection of dynamic properties of human postural control is insufficient out[3,7,10-12]. Changes in COP relative to the balance control system in children have also been studied[13-15]. However, few studies have focused on the dynamic aspect of postural control by spectral analysis of ground reaction force[11]. Therefore, the present study focuses on the vertical ground reaction force (VGRF), the unique external controllable force that can support the human body against gravity during a quiet stance. We extracted VGRF data from conventional stabilometry outputs of a previous study consisting of more than 2000 volunteers ranging from 3 to 93 years of age[16], as VGRF reflects the dynamic properties of the postural control. We analyzed VGRF by frequency domain to characterize human balance control as a function within a dynamic system. We then evaluated changes in spectral features relative to age to clarify the relationship between the human balance function and human aging and/or development.
Among[16], 2201 healthy volunteers (age range, 3 to 94) from our previous study, 1745 (784 males 961 females) were analyzed. Data with obvious artifacts were excluded by visual inspection of the original waveforms and power spectra. The distribution of age includes 9 groups: I, 3-10 years (n=412); II, 11-20 (n=358); III, 21-30 (n=339); IV, 31-40 (n=152); V, 41-50 (n=88); VI, 51-60 (n=89); VII, 61-70 (n=160); VIII, 71-80 (n=119); and IX, 81-94 (n=28). Informed consent was obtained from every participant.
All subjects were asked not to move their head or limbs and to stand quietly on the force plate with feet together for 60 s with their eyes open (EO) and then for 60 s with their eyes closed (EC). Body sway was recorded using a stabilometer (G5500, Anima, Japan).
The load cell signals were sampled at 20 samples per second and filtered with a 12-bit analog to digital (A/D) converter at 0.05-50 Hz. The three calibrated load cell signals Fi(t)(i=1,2,3) from stabilometry are summed to give the time series VGRF(t)≡ΣiFi(t)(Fig. 1A and 1B).
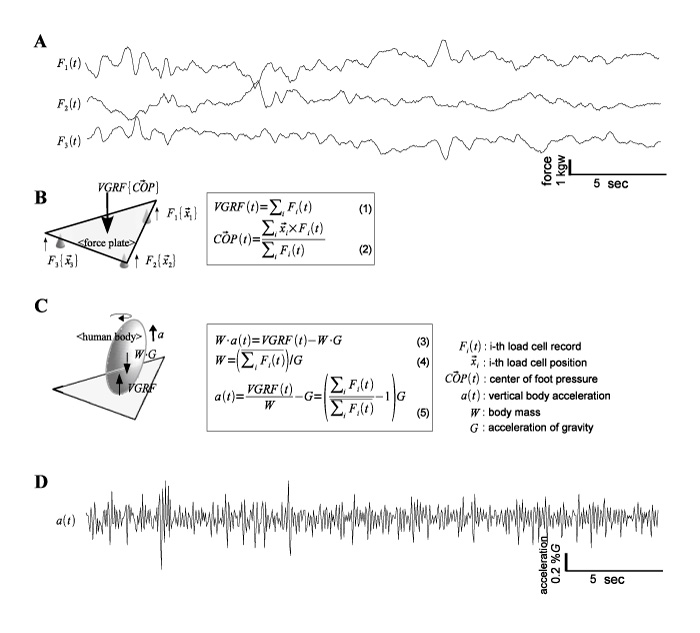
Fig. 1
Overview of the study paradigm and protocol. Time series data Fi(t) (i=1,2,3) (A) for a male subject (51 years old) are acquired from the three load cells located at positions xi of the stabilometer (B). The equilibrium of forces and moments acting on the force plate formulated VGRF(t) (1) and the position of the center of foot pressure COP(t) (2). Specification of the vertical forces acting on the human body (C) gives the equation of motion (4). Thus, when the body mass is estimated by averaging VGRF(t) over time (5), the vertical acceleration a(t) is formulated as (6). An example of the calculated a(t) time series (D) with the same time scale as A.
Individual body mass W is calculated by averaging VGRF over time W≡(ΣiFi(t))/G, where constant G denotes acceleration of gravity. The vertical acceleration a(t) is derived from the equation of motion of the body: a(t)=VGRF)T/W-G(Fig. 1C). An example of the a(t) time course of a 51 year-old man subject for the initial 30 s is shown in Fig. 1D. The magnitude of the vertical vibration is represented by the secondary moment (variance) of the acceleration. The average frequency f is computed as an indicator of trend in the frequency domain using the power-weighted mean, where p(f) denotes the power at frequency f f≡∫ f.p(f)df/∫p(f)df.
Each time series VGRF(t) and a(t) was divided into 3 data epochs with the length of 600 time points (30 s) lagged for half the length and for each epoch, a fast Fourier transform is then applied. The periodograms were smoothed across epochs and averaged with moving 15 frequency point (0.5 Hz) windows to estimate the power spectral density function (PSD).
To examine the precise age effects on the parameters, polynomial regression models were also examined by age group. The maximum significant degree of the polynomial models were determined (P<0.01) for both EO and EC according to the likelihood ratio tests (LRT), step by step between degrees k and k+1 (k=1, 2, 3...).
For the power profiles of vertical vibration, we performed ANOVA for every frequency point to specify the bands with continual frequency points, where the PSD levels have significant difference (P<0.01) among age groups. Multiple comparison tests were performed using the pairwise t-test at the specified frequency bands after adjusting the p-values by Holm’s method. The power ratio of EC to EO (EC/EO) was calculated in decibels (dB) for all subjects and averaged for each age group to give dB of geometric mean.
The relationship between magnitude of vibration indicated by the variance of vertical acceleration in dB and age was analyzed for EO (Fig. 2A) and EC (Fig. 2B). LRT showed the maximum significant degree (P<0.01) of 4 for the polynomial regression models. The coefficient estimation and ANOVA of each regression model are shown in Table 1. Adjusted R2 was 0.457 for EO and 0.472 for EC. Each of the fitted quartic curves had a unique local minimum and the ages where the local minimum occurred were 32.3 years for EO and 29.7 years for EC. The bottom trend (which is defined as the slope of the common tangent) and the center (the midpoint between these points of tangency) of the curve were 0.084 dB/year and 53.8 years for EO and 0.091 dB/year and 52 years for EC, respectively. The average frequency of vibration (Fig. 2C and 2D) constantly increased from 5 Hz in group I to 6 Hz in group VII: in this age range (3-70 years), a significant shift of frequency was found between every adjacent age group (P< 0.01).
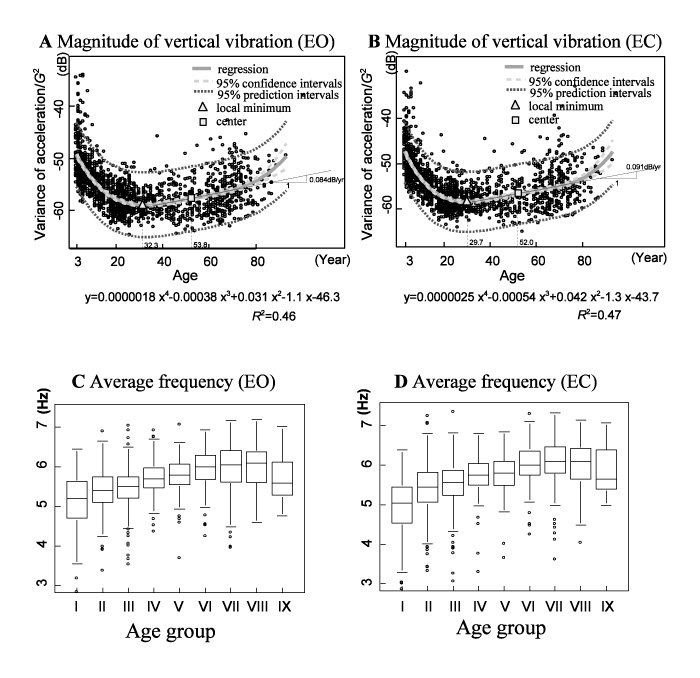
Fig. 2
Aging effect on general features of vertical vibration. Changes in magnitude of vibration of the human body in the vertical direction are represented by variance of vertical acceleration in decibels (dB) relative to age for eyes open (EO) (A) and closed (EC) (B) conditions. The maximal significant degree is determined to be 4 by comparing polynomial regression models step by step using the likelihood ratio test (LRT). A fitted quartic curve is drawn with 95% confidence and 95% prediction intervals. Position of the local minimum, position of the center, and the trend of the bottom of the U-shape curve are marked on each chart to characterize the age-related change. The vertical magnitude, at first, decreases toward the local minimum age of 32.3 (EO) or 29.7 (EC) years old, and then gradual increases (with slope less than 0.1 dB/year), with a center is at 53.8 (EO) or 52.0 (EC) years old. Deviation from this trend occurs at little more than 70 years for both conditions. C and D exhibit changes in the average frequency of vibration through the age groups in the box and whisker plot. The average frequency is increased starting from 5 Hz in group I to 6 Hz in group VII.
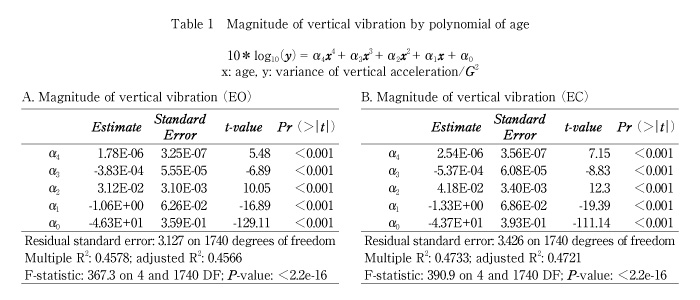
Figure 3A presents VGRF power for each group with EO. The 1.5-2.5 Hz component declined with age by 10 years of age, which was still high in young children (I), and the 5.0-8.0 Hz component increased from group III to VIII. Two significant bands were found at 1.5-2.5 Hz and 5.0-8.0 Hz. Bands 1.5-2.5 Hz and 5.0-8.0 Hz for EC were similar to those for EO; a peak at 3 Hz in group II was found only for EO (Fig. 3B). The acceleration power for each age group is shown in Fig. 3C and 3D. While ANOVA showed significant differences among age groups, younger adults (group III-VI) shared similar power profiles with a gradual increase in the range 2-5 Hz, a peak at around 6.5 Hz and a steep decrease above 6.5 Hz. Again, only group II showed a peak at 3 Hz for EO.
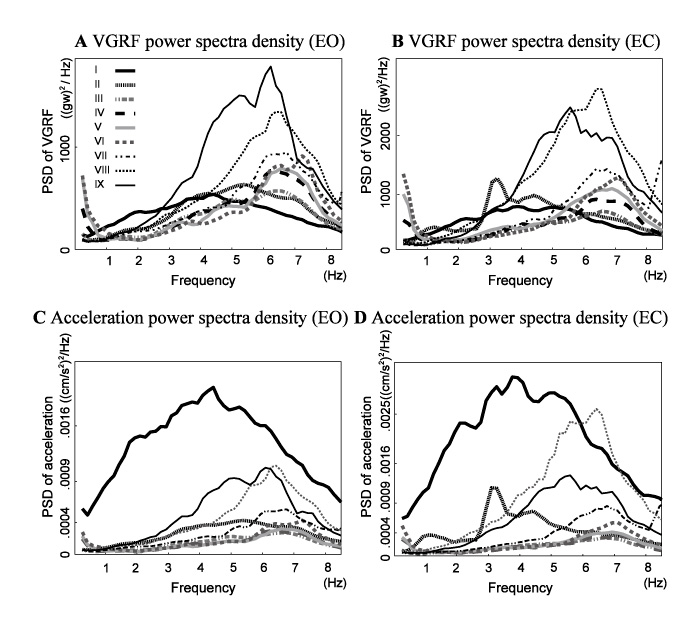
Fig. 3
VGRF power spectra density (PSD) estimates for each age group for EO (A) and for EC (B). Acceleration PSD for EO (C) and EC (D). While younger adults (group III-VI) have low stable power profiles, children (I-II) and elderly people (VII-IX) show deviating profiles, with large areas of acceleration power.
The results of the multiple comparison tests at significant bands are shown in Fig. 4. Significant differences at 2.0 Hz and 6.5 Hz were found between the elderly groups (VIII-IX) and younger adult groups (III-VI) and between the youngest groups (I-II) and younger adult groups (III-VI) (Fig. 4A and 4C). Significant differences at 3 Hz were detected between the oldest group IX and groups VI-VII and between groups II and VI-VII, while significant differences at 7.0 Hz were between groups VIII and III-VI.
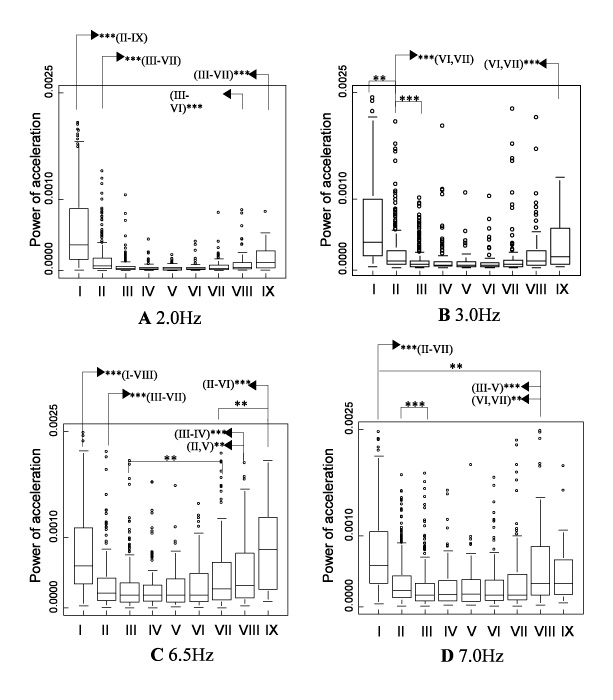
Fig. 4
The box and whisker plots of acceleration power at typical frequency points within the significant bands (A: 2.0 Hz, B: 3.0 Hz, C: 6.5 Hz, and D: 7.0 Hz) for EO. Results of multiple comparison are also shown (pairwise Wilcoxon test with p-value adjustment via Holm’s method. ***P<0.001; **P<0.01).
The effects of EC on PSD of vertical vibration are shown in Fig. 5(Fig. 5). The increase in overall magnitude of vibration was large for both young children and elderly people. The peak at 3 Hz for groups I and II, in addition to 7-Hz peak for group IX, was remarkable.
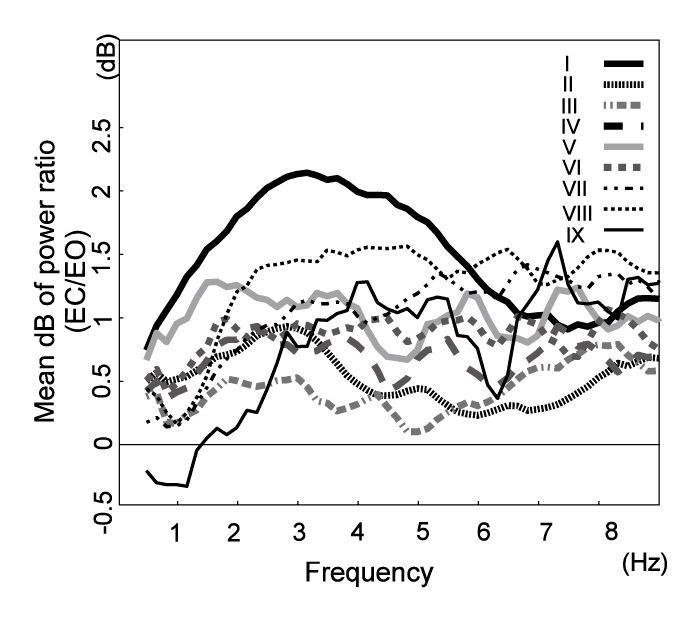
Fig. 5
The effect of EC on vertical vibration. Power profiles of the changes calculated by averaging the ratio over the age groups are shown. Young children (group I) exhibit markedly increased power for EC at the 3-Hz peak. Juveniles (II) also show a peak at 3 Hz. Elderly subjects have a high power ratio without any prominent peaks, except for at 7 Hz of group IX.
Our results of VGRF and vertical acceleration revealed that vibration of the human body in the vertical direction is affected by aging but not constantly throughout the life cycle. For subjects aged 21 to 60 years (group III-VI), the magnitude of vertical vibration reached a minimum at 32.3 (EO) or 29.7 (EC) years old with a comparatively low flat bottom centered at 52 or 54, respectively, and increase rate less than 1 dB per decade. Frequency analysis revealed similarly low power spectra for this age range, and vertical vibration showed no significant effect relative to aging (Fig. 4).
These same subjects (III-IV) also showed deviations in their power profiles from both the young subjects (I-II) and the elderly subjects (VIII-IX). In fact, the multiple comparison test at 6.5 Hz showed significant difference between III-VI and I-II and between III-VI and VIII-IX. These overall tendencies were also observable for the magnitude of vibration (Fig. 2A and 2B).
The patterns of these age-related changes were comparable with those of the path length on the horizontal plane. The profiles shared a local minimum around 30 years and a low flat bottom centered at around 50 years with a slight increase at a rate about 1 dB/decade, while having steep deviations for both young and elderly subjects. The result patterns were a well-fitted quartic curve.
Assuming that the increase in vibration power represents an increase in energy expenditure needed to control a quiet stance, the low stable power observed in subjects aged 20-60 years suggests stability and/or efficacy in the human postural control system. Conversely, the higher profiles in the younger (3-10 years) and elderly subjects (61-93 years) suggest either immature or declined stability and/or efficacy of the system.
The human postural control is achieved by a complex control system composed of multiple subsystems, such as visual, proprioceptive and vestibular[3,10] . To characterize the complex dynamic properties of the system, analysis of output signals in the frequency domain is useful[10,11,17,18]. Our study of the EC/EO power ratio (Fig. 5) indicates an enhanced magnitude of vibration, specifically a peak at 3 Hz in younger subjects (3-20 years old). Whether these peaks are valid, that is, whether they reflect either substantial PSD rise in EC or substantial PSD fall in EO, was investigated. Investigating acceleration PSD of younger subjects revealed a real peak at 3 Hz for EC (Fig. 3A), but no peaks for EO (Fig. 3B); although PSD of group I had a less prevalent peak than that of II, both differed from the neighboring frequency bins. This 3-Hz component in young subjects might represent the instability derived from immature compensation for the visual system, indicating the importance of visual input in the stability of postural vibration in the vertical direction at 3 Hz in children. In addition, vestibular-proprioceptive system may be immature in children. Of note, a 7-Hz positive peak in the group IX series are also observed, but inspection of PSD for EO and EC revealed no substantial peak.
Studies have focused on the horizontal fluctuation in COP to estimate individual abilities to control posture[7-9,13-15]. COP is primarily the point of action on the support plane of the resultant VGRF that, assuming a quasi-static state, balances gravity; in this situation, the body achieves equilibrium at every moment, i.e., both momentum and angular momentum remain constant. As COP approximates well the projection of the center of mass at the surface of support in the proposed models for human postural control[19-23], changes in COP have often been analyzed to indicate the degree of postural stability. Conversely, COP inclines to represent quasi-static, i.e., less dynamic, properties of postural stability. In fact, studies have questioned whether COP measurements are sensitive enough to detect early changes or dynamic features in standing balance[3,11-13].
In this study, acceleration was obtained based on measurement of real forces acting between the sole and support platform in the vertical direction (VGRF), which was actually mobilized during maintaining an upright stance while damping the perturbation from various origins[24,25]. Thus, we suggest that estimates of VGRF record the dynamic events eliciting the act of postural control and thus indicate dynamic properties of the system.
In conclusion, measuring vertical acceleration of the human body is expected to play a substantial role in assessing developmental and/or age-related changes in human postural control functions.
転倒が高齢者の生活の質に与える影響の重大さに鑑みれば,転倒リスクの評価方法の考案は危急の課題である。現在この指標の一つとして用いられている重心動揺計検査では,外乱に対する迅速な応答特性を必ずしも反映しない可能性が指摘されている。これに対し,荷重計出力の和として簡便に算出される垂直床反力は,動揺に対するダイナミックな姿勢制御特性を反映すると考えられる。本研究では,健常人の垂直床反力がもつ諸特性の加齢変化を解析し,これが転倒リスク評価の指標となる可能性について検討した。
3歳から93歳までの1,745名の健常ボランティアに対して行われた重心動揺検査データを対象とし,荷重計出力データより垂直床反力および鉛直加速度を求め,周波数解析を行った。分散分析にて10歳ごとの年齢群間に有意差のある周波数帯域を特定し,各周波数で群間比較した。
垂直床反力及び加速度の全変動(分散)は未成年と高齢者で高い典型的な鞍型の変化を示した。1.5-2 Hz帯域の鉛直振動のパワー及び2-6 Hz帯域での閉眼/開眼比は10歳以下群で著明に高く,いずれも20歳までに減弱した。51歳以上の群では,5-8 Hz帯域のパワーが加齢に伴って増加した。
本研究では従来報告されていなかった立位時鉛直方向振動と加齢の関係を,1,000人規模の調査をもとに解析した。未成年の閉眼時2-6 Hz帯域を中心とする振動は姿勢制御における前庭-視覚系の責任と,前庭-脊髄系の未発達とを示唆した。高齢者については,本研究により5-8 Hz帯域の鉛直方向振動が加齢変化をよく反映することが示されたことから,転倒リスク指標の候補たりうる可能性が示唆された。
1) Section for Human Neurophysiology Research Center for Frontier Medical Engineering, Chiba University, Chiba 263-8522.
2) Department of Integrative Neurophysiology, Graduate School of Medicine Chiba University, Chiba 260-8670.
3) Kameda General Hospital.
笠置泰史1,2), 下山一郎1),吉田 晋1,2),中澤 健2),福武敏夫3): 静止立位時鉛直方向振動の加齢変化.
1) 千葉大学フロンティアメディカル工学研究開発センター脳機能計測解析研究部門, 2) 千葉大学大学院医学研究院神経情報統合生理学,3) 亀田総合病院
Tel. 043-290-3118. Fax. 043-290-3118. E-mail: ykasagi@yahoo.co.jp
2008年12月4日受付,2009年4月13日受理.