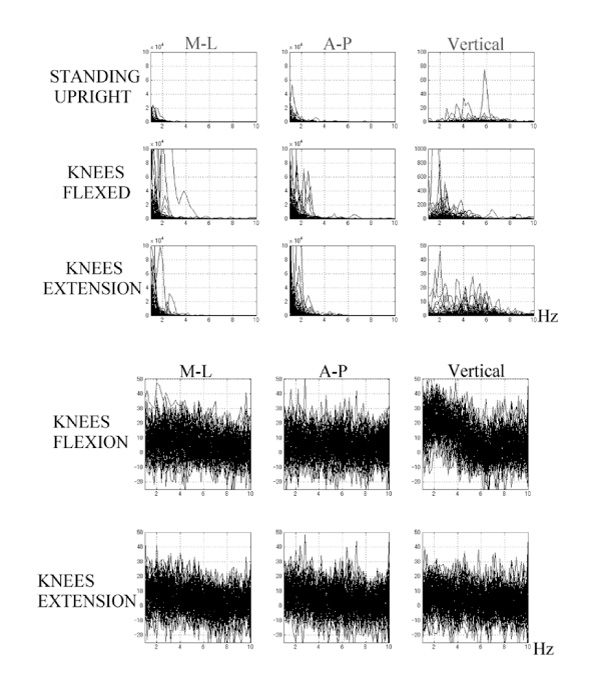
Fig. 4
Upper 9 graphs showed power spectra of COP oscillations for all subjects, during standing upright (upper 3 graphs), knees flexed (middle 3 graphs) and knees extension (lower 3 graphs). The left column showed spectra for a medial-lateral direction, the middle column showed spectra for an anterior-posterior direction, and the right column showed spectra for a vertical direction. The abscissa represented frequency in Hz, and the ordinate represented powers of the oscillations. Lower 6 graphs showed normalized power spectra of COP oscillations during knees flexed (upper 3 graphs), and knees extension (lower 3 graphs) for all subjects. The left column showed the oscillations for medial-lateral direction, the middle column showed those for anterior-posterior direction, and the right column showed those for a vertical direction. The abscissa represented frequency in Hz, and the ordinate represented the powers of oscillations in dB.