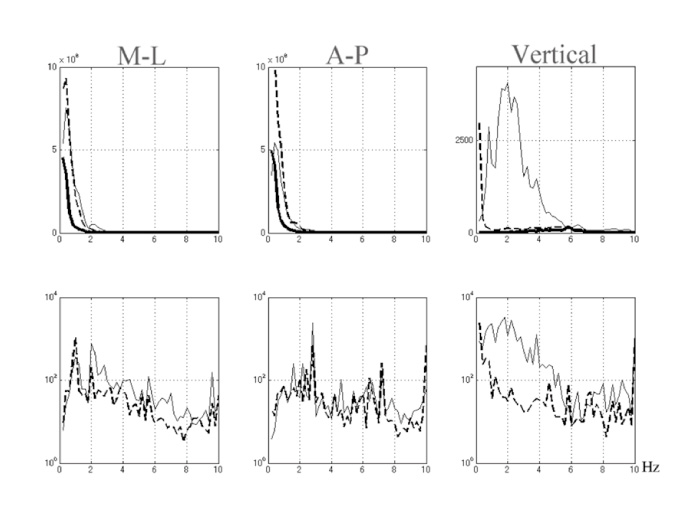
Fig. 5
Grand mean power spectra of COP oscillations during standing upright (thick plots for upper only), knees flexed (thin plots) and knees extension (dotted plots). The upper row was for power spectra and the lower row was for the normalized power spectra with powers at standing upright. The left column showed the oscillations for a M-L direction, the middle column showed those for an A-P direction, and the right column showed oscillations for a vertical direction. The abscissa represented frequency in Hz, and the ordinate represented powers of oscillations.