


Volume 86, Number 3
doi:10.20776/S03035476-86-3-P99
[Original Paper]
Ichiro Shimoyama1), Yumi Asano2), Atsushi Murata2) Naokatsu Saeki3) and Ryohei Shimizu4)
(Received September 29, 2009, Accepted December 9, 2009)
The aim of this study was to develop a novel quantitative method for examining the cube copying test. The analysis has been only through qualitative observation for the test. Therefore we applied a quantitative method to analyze cube copying test results. Figures were digitized and their symmetry was studied to determine correlation coefficients (CCs). This study included 19 elderly subjects (68-92 years) who complained of memory disturbance or being afraid of dementia, and 9 younger subjects (21-60 years) who visited our hospital with minor head trauma or dizziness. Six CCs were examined between the sample and drawn figures, between the drawn figure and 180°-rotated drawn figure, between the left half and right half of the drawn figure, between the upper half and lower half of the drawn figure, between a quadrant and an opposite 180°-rotated quadrant of the drawn figure. All CCs were significantly low for the elderly group. The elderly group also showed mild deterioration in the Hasegawa’s Dementia Scale (21. 1/30) and CT findings with cortical and/or ventricular dilatation and lacunae. No neurological deficit was noted for the younger group. Our quantitative method may be useful for evaluating not only constructional apraxia but also dementia and mild cognitive impairment.
quantitative analysis, constructional apraxia, drawing test, cube, HDS-R
CC: correlation coefficient; HDS-R: Hasegawa’s dementia scale
Apraxia, which literally means “no work”, involves the disturbance of purposeful expressive functions[1] . Neither constructional apraxia nor dressing apraxia is a strict form of apraxia with regards to a loss of previous learned behavior[2] . That is, patients with normal motor function cannot be programmed to perform such purposeful expressions, e.g., finger figuring[3], cubic block sign test, and drawing a cube[4] . Testing of such parameters, i.e., copying a projected cube, is simple and effective for diagnosing constructional apraxia[5-9], particularly in out patients. However, evaluation of these tests is achieved qualitatively and subjectively using a scoring method[8,9], increasing its objective bias and limiting diagnosis to exasperated cases. To the best of our knowledge, no subjective quantitative analysis has been reported for the cube copying test. Therefore, the aim of this study was to develop a quantitative method to examine mild cognitive impairment.
Each subject was presented a projected cube (with one side 4 cm long) on a sheet of paper and asked to draw (“copy”) it within a certain area on the same sheet, as shown in (Fig. 1A). The sheet was placed on a digitizer while the subject drew the cube. The figure drawn by the subject was digitized and stored in the memory of the digitizer for further study.
The study enrolled 19 out patients, aged 68 to 92 years, who visited our hospital with a chief complaint of memory disturbance or fear of dementia. For a control group, the study also enrolled 9 younger patients, aged from 21 to 60 years, who visited the hospital with minor head trauma or dizziness, but no neurological deficit. Each subject was informed the purpose of the study and provided written informed consent before performing the test.
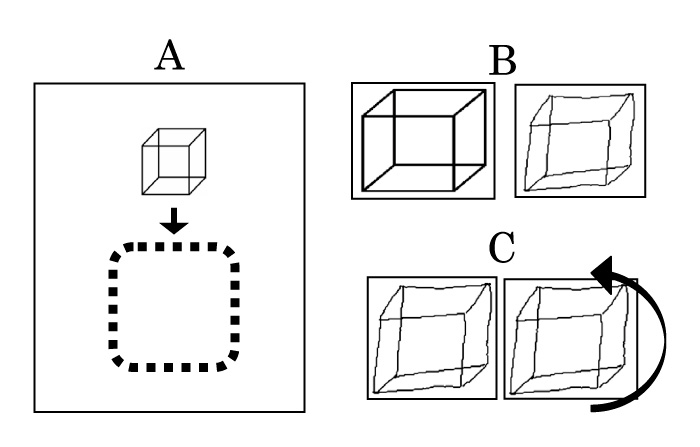
Fig. 1
A: A sample sheet of the drawing a cube test. A picture of a cube is shown at the top of the page and is copied within the dotted space by the subject. B: Sample figure (left) and example of a drawn figure. The correlation coefficient (CC) between the sample and drawn figures was 0.36 for CC-1. C: Two drawn figures. The right figure was rotated 180°. The CC between the two drawn figures was 0.43 for CC-2.
The digital data were imported to a personal computer with minimal patient identification, i.e., age, gender, and score of Hasegawa’s Dementia Scale-revised (HDS-R) for elderly subjects. The size of the drawn figure was adjusted to that of the example figure and the lines of the drawn figure were smoothed. The following six correlation coefficients (CCs) were calculated for each drawn figure using MatLabR (R2007b, Math Works, USA): CC1, between the drawn and example figures (Fig. 1B); CC-2, between the drawn figure and its 180° rotation (Fig. 1C); CC-3, between the right and left halves of the drawn figure (Fig. 2A); CC-4, between the upper and lower halves of the drawn figure (Fig. 2B); CC-5, between the right upper quadrant and left lower quadrant, which was rotated 180°, of the drawn figure (Fig. 2C); and CC-6, between the right lower quadrant and left upper quadrant, which was rotated 180°, of the drawn figure (Fig. 2D). The analysis of variance was done for the CCs, and significant differences were determined using the Piason’s test.
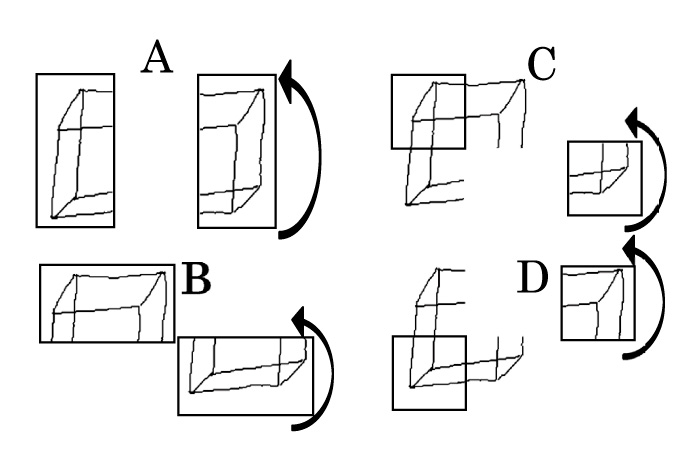
Fig. 2
A: An example of a drawn figure separated into two halves (right and left) for determining CC-3. The CC between the left half and the 180°-rotated right half of the drawn figure was 0.46 (P=0.013; n=215, 112, t=1.96). B: The same drawn figure separated into two halves (upper and lower) for determining CC-4. The CC between the upper half and the 180°-rotated lower half of the drawn figure was 0.42 (P=0.013; n=108, 223, t=1.96). C: The same drawn figure separated into four quadrants for determining CC-5. The CC between the left upper and the 180°-rotated right lower quadrants of the drawn figure was 0.38. D: The same drawn figure separated into four quadrants for determining CC-6. The CC between the left lower and the 180°-rotated right upper quadrants of the drawn figure was 0.49 (P=0.018; n=107, 112, t=1.96).
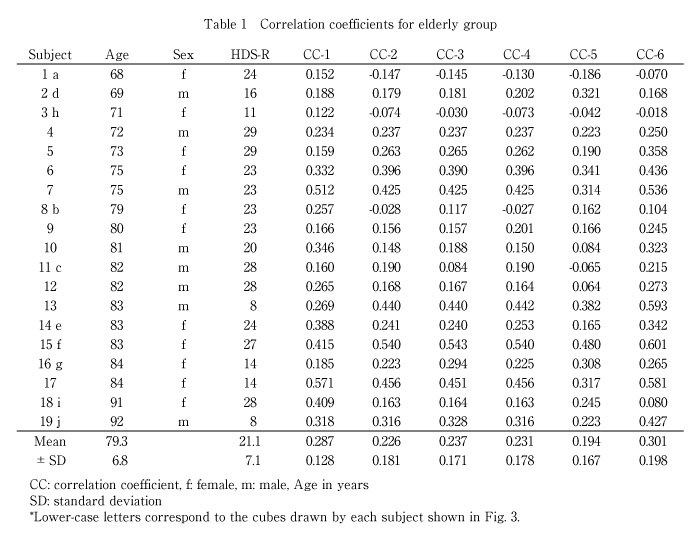
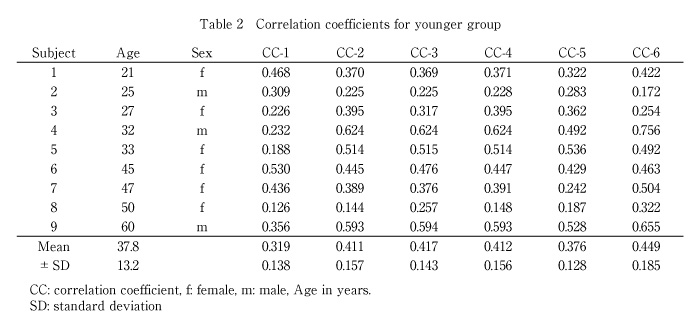
Figures 1B (Fig. 1B), 1C (Fig. 1C), and 2 (Fig. 2) show the process to obtain the 6 CCs for subject 6 in Table 1 (Table 1) whose HDS-R 23/30 and CT findings showed mild cortical atrophy. In this example, CC-1, between the drawn and sample figure, was 0.36 and CC-2, between the drawn figure and its 180° rotation,was 0.43; the significance level was 0.009 for the Piason’s test (n=215×223, t=1.96). CC-3, between the left and 180°-rotatedright halves of the drawn figure, was 0.46; the significant level was 0.013 (n=108×112, t=1.96). CC-4, between the upper and 180°-rotated lower halves of the drawn figure, was 0.49; the significant level was 0.018 (n=107×111, t=1.96). CC-5, between the left upper and the 180°-rotated right lower quadrants of the drawn figure, was 0.38. CC-6, between the left lower and the 180°-rotated right upper quadrants of the drawn figure was 0.49. Both had a significant level of 0.018 (n=107×112, t=1.96). Figure 3 (Fig. 3) shows examples of cubes drawn by the elderly group. Most of the drawn cubes were moderately deteriorated (a-h), while two (i and j), drawn by 91- and 92-year-old subjects, respectively, were relative to controls. Tables 1 (Table 1) and 2 (Table 2) show the CCs for the elderly and younger groups, respectively. Significant differences were observed between these groups (P<0.0001). There were no significant correlations between age and CC, and between HDS-R scores and CC.
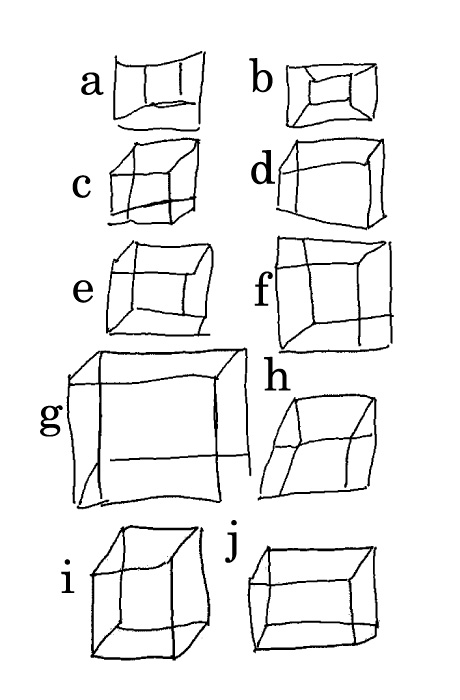
Fig. 3
Examples of figures drawn by elderly subjects listed in Table.
Quantitative analysis found significant differences between the elderly and younger control groups. Based on this analysis, no subjects were diagnosed with typical constructional apraxia; however, as seen in Fig. 3 (Fig. 3) , drawing ability was deteriorated for some elderly subjects who showed mild deterioration for HDS-R and diffuse abnormality in the CT scan. HDS-R is a simple and adequate method to screen for dementia. Currently, this scale is frequently used by family doctors. However, HDS-R was developed to screen for dementia without a performance test[10]. Our results showed no relationship between HDS-R and CC, indicating the addition of a performance test would be beneficial for elderly patients. Similar to the mini-mental state examination, another simple screening test using a drawing test[11], HDS-R, especially for elderly patients, should be used together with a drawing test. Posterior parietal cortex plays a major role in drawing by copying[12]. Typical constructional apraxia in patients has been associated with parietal lesions[5,6]. In this study, no solitary lesions over the parietal areas were noted for elderly subjects on CT, and no elderly subjects showed spatial neglect. As functional magnetic resonance imaging, single photon emission computed tomography, or positron emission tomography could not be performed in our hospital, apraxia could not be confirmed. However, mild cognitive impairment is speculated from the CT findings and moderate deterioration in HDS-R. This study proposes inclusion of a cube copying test with HDS-R for elderly patients. We are currently investigating the implementation of this cube copying test for sensitive screening of mild cognitive impairment.
図形の模写や指まね検査は,構成失行の簡便な検査として古くから利用されてきたが,その判定基準は定性的で主観が混入する。高齢社会の今日,正常な加齢現象か認知症など初期症候の一部なのか早期に客観的に診断する必要がある。そのために立方体模写検査について数値解析を提案し,高齢者群と正常対照群について試行した。解析方法は図形をデジタイザーで電子化し,正規化し2値化して2次元の相関係数を求めた。相関係数は6要素についておこない,第1に手本の図形と書かれた図形の相関係数をもとめ,第2に書かれた図形の点対称性を調べた相関係数を求め,第3に,書かれた図形を左右に2分して,左右の相関係数を求めた。第4に書かれた図形の上下2分した相関係数を求めた。第5・6に上下左右に4等分した対角線上の2図形の相関係数をそれぞれ求めた(MatLabR, R2007b, Math Works, USA)。対象は著者の病院外来を受診した患者さんに研究の説明後同意を得て検討した。高齢者群は,記憶低下または認知症を懸念した68~92歳の19名,対照群は,軽度頭部打撲またはめまいを主訴で来院し神経学的検査で異常の認められなかった21~60歳の9名とした。分散分析にてこの2群に有意差が認められ,高齢者のほうが有意に対称性は低値であった。なお高齢者群は改訂長谷川式簡易知能評価スケールを施行し平均値は21.1点で標準偏差は7.1点であった。対照群のCTスキャンは正常範囲で異常は認められなかったが,高齢者群のCTスキャンでは無症候性梗塞や皮質萎縮や脳室拡大が認められた。今後さらに改良を重ね詳細に分類していきたい。
下山一郎1),浅野由美2),村田 淳2),佐伯直勝3),清水良平4)): 立方体投射図形模写検査の定量的解析法の開発.
1) 千葉大学フロンティアメディカル工学研究開発センター脳機能計測解析研究部門
2) 千葉大学医学部附属病院リハビリテーション部
3) 千葉大学大学院医学研究院脳神経外科学
4) 清水脳神経外科
Tel & Fax. 043-290-3118. E-mail: ichiro@faculty.chiba-u.jp
2009年9月29日受付,2009年12月9日受理.