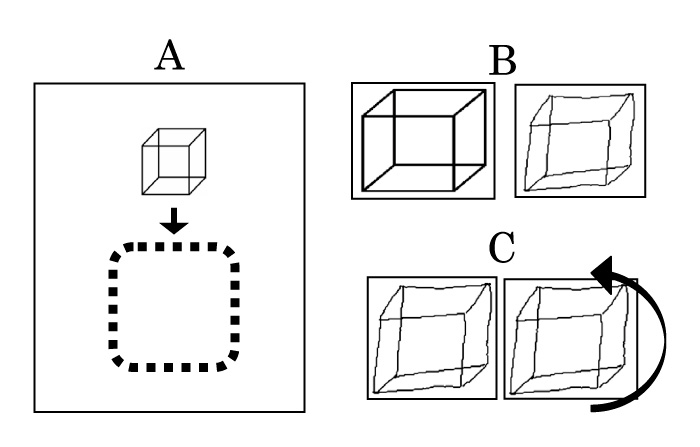
Fig. 1
A: A sample sheet of the drawing a cube test. A picture of a cube is shown at the top of the page and is copied within the dotted space by the subject. B: Sample figure (left) and example of a drawn figure. The correlation coefficient (CC) between the sample and drawn figures was 0.36 for CC-1. C: Two drawn figures. The right figure was rotated 180°. The CC between the two drawn figures was 0.43 for CC-2.