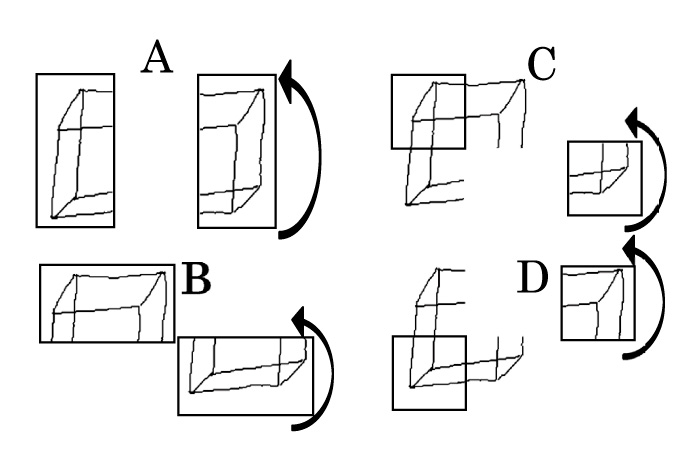
Fig. 2
A: An example of a drawn figure separated into two halves (right and left) for determining CC-3. The CC between the left half and the 180°-rotated right half of the drawn figure was 0.46 (P=0.013; n=215, 112, t=1.96). B: The same drawn figure separated into two halves (upper and lower) for determining CC-4. The CC between the upper half and the 180°-rotated lower half of the drawn figure was 0.42 (P=0.013; n=108, 223, t=1.96). C: The same drawn figure separated into four quadrants for determining CC-5. The CC between the left upper and the 180°-rotated right lower quadrants of the drawn figure was 0.38. D: The same drawn figure separated into four quadrants for determining CC-6. The CC between the left lower and the 180°-rotated right upper quadrants of the drawn figure was 0.49 (P=0.018; n=107, 112, t=1.96).