


Volume 86, Number 4
doi:10.20776/S03035476-86-4-P129
[Original Paper]
We studied the difference between the strengths of the dominant and non-dominant hands in healthy Japanese adults. One hundred and twenty-two volunteers were tested using a calibrated JAMAR hydraulic dynamometer and Hydraulic Pinch Gauge. Five subjects were excluded because they were left-handed. One hundred and seventeen subjects were right-handed. The age, sex, and hand preference were recorded for each subject. Fifty-one subjects were men, and sixty-six were women. The mean age of the subjects was 28 years (range: 20~46). In right-handed men, the mean grip strength was 41.9kg in the dominant hand, and 38.4kg in the non-dominant hand, and key pinch strength was 11.4kg and 10.7kg, respectively. Grip strength and key pinch strength in the dominant hand were 10% and 7% stronger than in the non-dominant hand. The corresponding values for right-handed women were 25.4kg and 22.7kg, and 7.9kg and 7.5kg. Grip strength and key pinch strength in the dominant hand were 12% and 6% stronger than in the non-dominant hand.
grip, pinch, strength, dominant, non-dominant, Jamar hydraulic dynamometer
It is widely accepted that, grip and pinch strength measurements provide an objective index of the functional integrity of the upper extremity. In the assessment of the level of injury or recovery, the data of the unaffected side is often referred to, as substitution of the pre-injury strength, which can never be measured. But in such cases, the effect of hand dominance should be considered, to be more accurate. In the previous reports, which are all from western countries, grip strength difference between the dominant and non-dominant hand varied from almost none to 13%. Also, in some reports the effect of hand dominance in pinch strength was reported.[1-9]So, we studied the difference and the relationship of grip and pinch strength, between the dominant and non-dominant hands in Japanese adults.
The study included 122 subjects, 53 men, and 69 women. Ages ranged between 20~46 years (mean 28 years). All subjects were healthy, non manual workers. There were 117 right-handed subjects and 5 left-handed subjects. Grip strengths were measured using a standard adjustable handle JAMAR dynamometer (Sammons Preston Rolyan). The upper-extremity position followed the recommendations of the American Society of Hand Therapists (Fess[10]): shoulder adducted and neutrally rotated, elbow flexed at 90°, forearm in neutral position, and wrist in slight dorsiflexion (0°-30°). (Fig. 1). The dynamometer was set at the second and the third position (of the five positions available) which were considered to be the best levels for grip evaluation (Crosby et al.[2]), and 3 trials for each position were conducted. The maximum value of these trials were recorded. Key pinch strengths were measured using a Hydraulic Pinch Gauge (BASELINE Inc. U.S.A) in the same position. 3 trials were conducted, and the maximum value of these trials were recorded. The same examiner held the instruments to avoid the effect of gravity, and the subject was asked to give maximum effort, keeping the arm in the same position. Rests for at least one minute were given between each attempt, to minimize fatigue affects. The difference between the dominant and non-dominant hand in grip strength and pinch strength was analysed using Wilcoxon signed-ranks test, and the correlation between grip strength and pinch strength of the same hand was analysed using Spearman’s correlation coefficient. p values equal to or less than 0.05 were accepted as significant (P≦0.05).
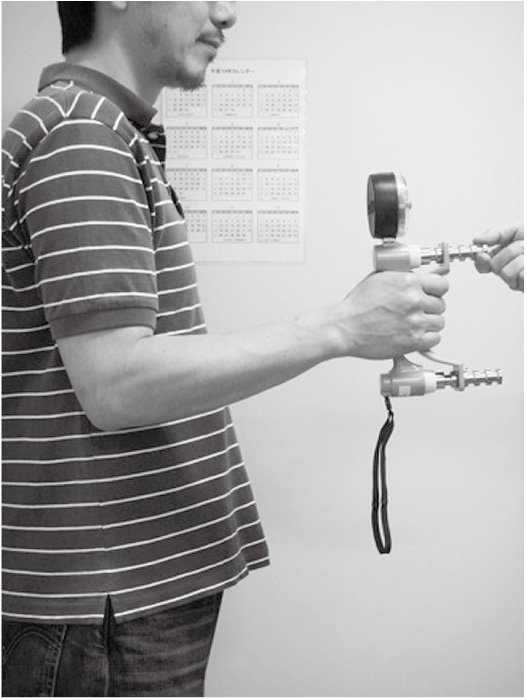
Fig. 1
Test position
Because there were very few left-handed subjects, we decided that they are not appropriate as a population for the study, and we evaluated the values of only the right-handed subjects. In right-handed men, the grip strength was 41.9±6.0 (Mean±S.D.) kg in the dominant hand, and 38.4±5.9kg in the non-dominant hand, and a statistically significant difference was found (P<0.001) between the dominant and non-dominant hand. Grip strength in the dominant hand was 10±14% stronger than in the non-dominant hand. The pinch strength was 11.4±1.7kg in the dominant hand, and 10.7±1.5kg in the non-dominant hand, and a statistically significant difference was found (P<0.001). Pinch strength in the dominant hand was 7±10% stronger. (Fig. 2)
In right-handed women, the grip strength was 25.4±5.2kg in the dominant hand, and 22.7±4.9kg in the non-dominant hand, and a statistically significant difference was found (P<0.001) between the dominant and non-dominant hand. Grip strength in the dominant hand was 12±11% stronger. The mean pinch strength was 7.9±1.1kg in the dominant hand, and 7.5±1.1kg in the non dominant hand, and a statistically significant difference was found (P<0.001). Pinch strength in the dominant hand was 6±11% stronger. (Fig. 3)
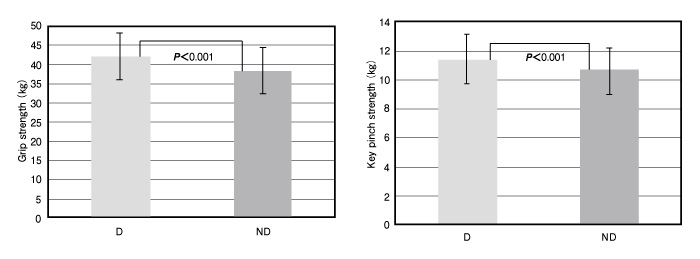
Fig. 2
Males: Grip strength and Key pinch strength; dominant (D) vs non-dominant (ND)
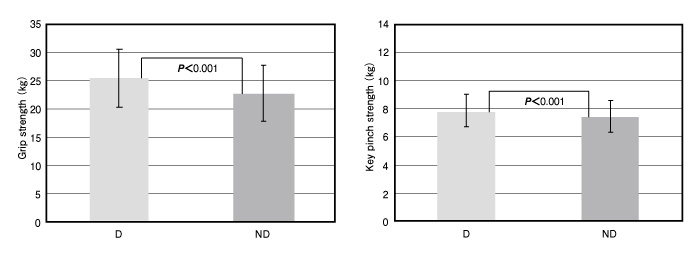
Fig. 3
Females: Grip strength and Key pinch strength; dominant (D) vs non-dominant (ND)
In right-handed men, grip strength and pinch strength of the dominant hand showed correlation, and the regression coefficients were calculated as follows; key pinch strength=0.13×grip strength+6.14kg (R2=0.20) (Fig. 4). Grip strength and pinch strength of the non-dominant hand also showed correlation, and the regression coefficients were calculated as follows; key pinch strength=0.10×grip strength+6.87kg (R2=0.15) (Fig. 5)
Grip strength and pinch strength of the dominant hand showed correlation in right-handed women as well, and the regression coefficients were calculated as follows; key pinch strength=0.08×grip strength+5.99kg (R2=0.12) (Fig. 6). Grip strength and pinch strength of the non-dominant hand showed weak correlation, and the regression coefficients were calculated as follows; pinch strength = 0.09×grip strength+5.55kg (R2=0.14) (Fig. 7)
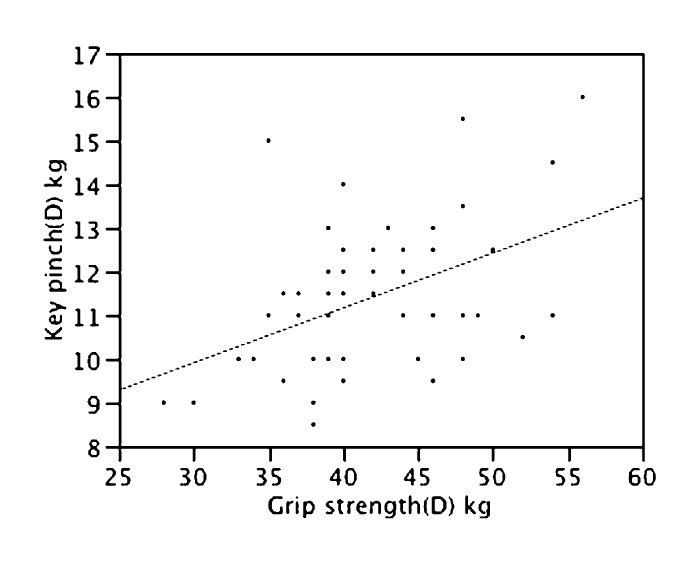
Fig. 4
Males: Dominant hand; Correlation between grip strength and key pinch strength
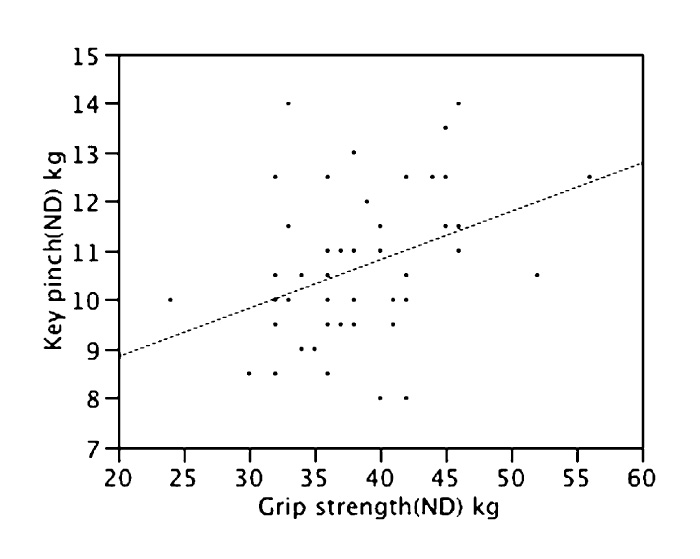
Fig. 5
Males: Non-dominant hand; Correlation between grip strength and key pinch strength
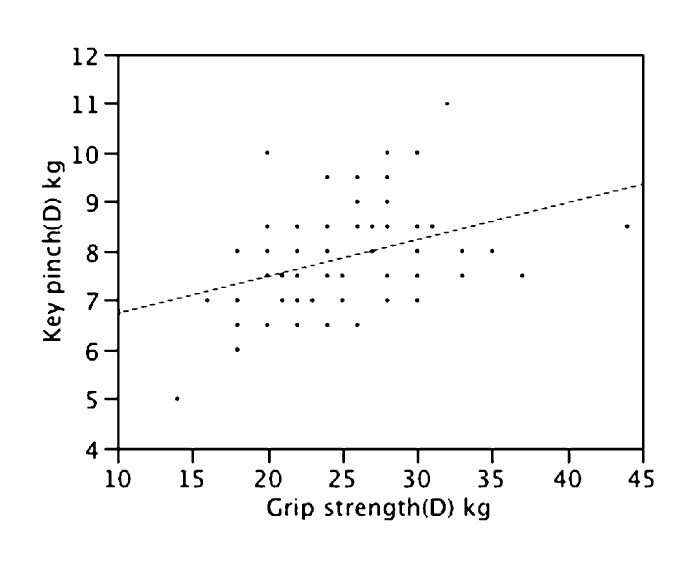
Fig. 6
Females: Dominant hand; Correlation between grip strength and key pinch strength
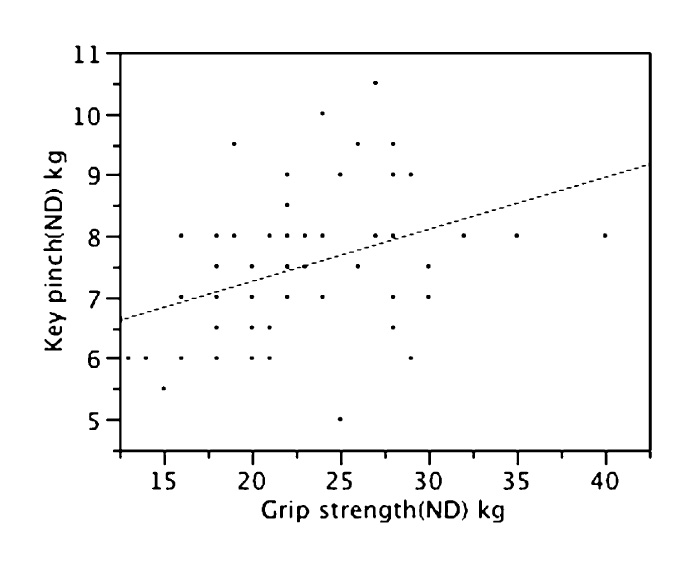
Fig. 7
Females: Non-dominant hand; Correlation between grip strength and key pinch strength
Clinically, when evaluating the severity of the disease or the therapeutic effect, many parameters are examined. Measurement of grip strength and pinch strength is concise, and is often used. When assessing these parameters, data of the unaffected side is often referred to, as substitution of the pre-injury strength, which can never be measured but is this really adequate?
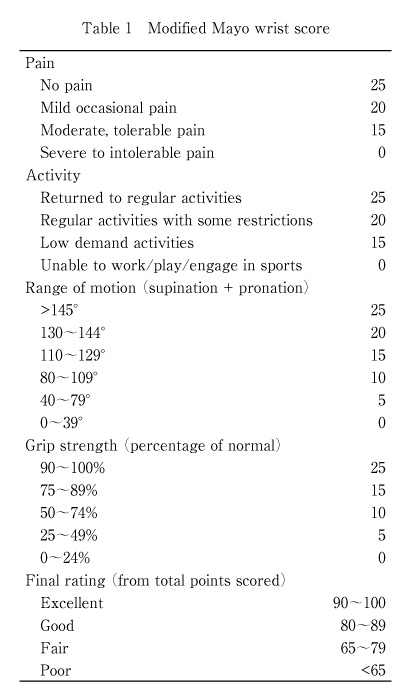
Modified Mayo wrist score (Table 1) is a frequently used method for evaluating the function of the hand. The levels of pain, activity, range of motion, and grip strength (percentage of unaffected side) is scored, and the total is categorized into 4 grades in the final rating. The author is right-handed, and the grip strength of the right hand is 42kg, and the same of the left is 37kg. If I had a fracture of my left distal radius, and even if the grip strength of my left hand recovers to 37kg, it would be 10 points minus on the same score. In some circumstances, it may lead to a lower grade in the final rating. Likewise, if the fracture were to be on my dominant hand, the grade may end up higher. In order to prevent such inconsistent evaluations depending on whether the injury was on the dominant or the non-dominant hand, we need to determine the relationship between grip strength and hand dominance, and evaluate more precisely.
Clerke A and Clerke J[3]reported that making a comparison with the contralateral will not always be accurate when estimating the pre-injury grip strength. There are some previous reports on relationship between grip strength and hand dominance. Bechtol[4]proposed the 10% rule, which states that a person’s grip strength in the dominant hand is approximately 10% greater than in the non-dominant hand. Other reports questioned whether the 10% role could be applied to the whole population; they reported that this rule might not be appropriate to adapt to the left-handed people[2,5-8,11]. Crosby et al.[2]explained that this might be because of the fact that it is a right-handed world, and most tools and daily appliances were designed for the right hand. As a result, the non-dominant (right) hand of left-handed people is exercised more often than the dominant (left) hand on a daily basis. In our study, 2 men and 3 women were left-handed. We excluded their values from our evaluations, not only because they were too small a number as a population, but for such reasons stated above. In our study, grip strength in the dominant hand was 10% stronger in men, and 12% stronger in women; these results support the previous reports. So, when using an evaluation method that include grip strength, it would be more accurate to first estimate the normative value of the affected hand from the measured value of the contralateral, then, compare it to the measured value of the affected hand.
Can the 10% rule also be applied in pinch strength as well? Takaoka et al.[12]reported that pinch strength was 10% weaker in the non-dominant hand, but others report that the difference was 5~9%[2,6]. In our study, the differences were 7% in men, and 6% in women, and these data support the previous reports. Evaluation methods including pinch strength do not seem to exist so far. But in some diseases, in which decrease of pinch strength is the chief complaint, such as ulnar nerve paralysis and carpometacarpal osteoarthritis of the thumb, pinch strength is measured as an important parameter of hand function. In such cases, the effect of hand dominance in pinch strength should be considered, just as it should in grip strength.
Although pinch strength is clinically an important objective data in such diseases listed above, pinch meters are not always available in every hospital. Initially, we thought we might be able to use grip strength as a substitute for pinch strength. But although there was some correlation, it was not so strong as we thought it might be. Therefore, in such cases, measuring pinch strength is essential, and should not be substituted by measuring grip strength.
我々は手の機能評価に重要な握力とピンチ力の利き手・非利き手間の関係について日本人を対象に調査・検討した。調査対象は上肢の外傷・疾患の既往のない健常者で総数は122名である。内訳は男性53名,女性69名で平均年齢28歳(20~46歳)である。測定肢位は立位・肩関節下垂・肘屈曲90度,前腕中間位,手関節軽度背屈位とした。握力はJAMAR握力計を使用し,2ndポジションと3rdポジションで1分以上の間隔をあけてそれぞれ3回ずつ測定しその最大値を「握力」とした。ピンチ力の測定はサイドピンチで行い,ピンチメーターを使用して同様に3回測定しその最大値を「ピンチ力」とした。それぞれに対して利き手と非利き手間で優位な差があるか,相関関係があるかを検討した。さらに,同一肢において握力とピンチ力の相関関係も検討した。握力もピンチ力も優位に利き手が高かった。男性の利き手握力は非利き手と比較して10%強く,女性は12%強かった。男性の利き手ピンチ力は非利き手と比較して7%強く,女性は6%強かった。また,同側の握力とピンチ力にも弱い相関関係を認めた。この結果から,手の機能評価は単純な健側との比較よりも,健側から予想される患側の握力・ピンチ力の正常値との比較を行うことが重要と考えられた。
鈴木崇根1),國吉一樹2) : 日本人における握力とピンチ力の利き手・非利き手差の検討.
Tel. 043-226-2017. Fax. 043-226-2018. E-mail: takane.suzuki@faculty.chiba-u.jp
2010年5月31日受付,2010年6月9日受理.