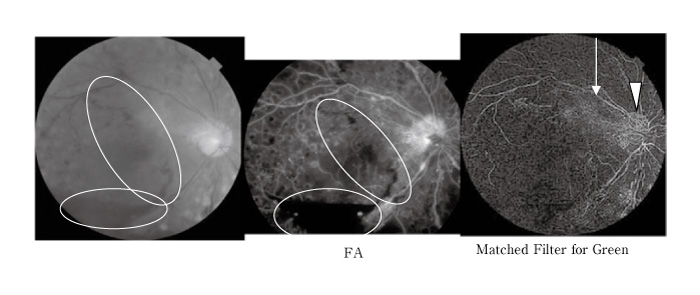
Fig. 3
Example images for proliferative diabetic retinopathy; the left image was the original image, the middle image was for fluorescein angiogram (FA), and the right image was for the matched filters. The ellipses showed vitreous hemorrhage, the arrows showed linear structure for proliferative tissue, and the arrow head showed neovascularization and proliferative tissue.