


Volume 87, Number 2
doi:10.20776/S03035476-87-2-P49
[Original Paper]
Nobuhito Matsushiro1), Ichiro Shimoyama2), Koki Yamashita1)
Ken Nakazawa3) and Yasufumi Kasagi2)
(Received July 14, 2010, Accepted December 9, 2010)
For near infrared red spectroscopy (NIRS), the debate over the reliability of its absolute value is ongoing, and discussed in this paper with alpha-blocking task. The purpose of the study is step by step clarification on NIRS reliability. The method in this paper is the evaluation with a task that is clinically important and has achieved a wide consensus and a diagnostics of its measurement. From this viewpoint, this paper discussed the NIRS measurement, with the electroencephalography (EEG) measurement of alpha-blocking as the task. Based on the EEG measurement results of alpha-blocking, we investigated the characteristic changes in the NIRS measurements; a correlation between the two measurements was found (0.806), based on alpha-rhythm patterns of EEG and the increasing or decreasing patterns of oxygen metabolism on NIRS. In addition, a correlation was found between complexities in the two measurements (0.677). The variation level of the complexity in the EEG measurements was 7.14 times larger compared with that of NIRS on average which suggests that the EEG measurements included much information than the NIRS measurements for alpha-blocking task. Despite, the correlation results suggest a possibility of NIRS application to alpha-blocking diagnosis. These numericals contribute to step by step clarification on NIRS reliability.
Alpha-Blocking, NIRS, EEG
From the latter half of the 20th century, “optical diagnostics” for measuring the functions of a living organism using light has rapidly developed[1]. Near infrared red spectroscopy (NIRS) is one of the most practical optical diagnostics[2,3], as it is convenient, and requires no special equipment or invasive measure such as radiation exposure. While there are devices for brain functions such as electroencephalography(EEG), isotope, and functional magnetic resonance imaging (fMRI), these techniques require a magnetically shielded room, thereby limiting the location at which measurements can be performed. Another advantage of NIRS is its ability to measure changes in blood circulation or oxygen metabolism in the brain for time-sequential, real-time monitoring[3]. NIRS is also attractive for clinical use, as it requires no medicine or expensive equipment thereby maintaining low initial and running costs. This technique also produces quite a good time resolution(a few tens of milliseconds), although its spatial resolution is about 8 mm or more, which is generally inferior to that of fMRI.
Considering its advantages, NIRS is being clinically applied to a wide range of medical fields[4], i.e., for brain surgery, where it is used to localize language function, for epilepsy surgery research, where it is used for psychiatric disorders such as schizophrenia, and for other fields including psychology and education[5]. Indeed, NIRS cannot completely replace other techniques such as positron emission tomography(PET)and fMRI, which have their own applicable uses in medicine and research, but rather these techniques may be used in conjunction with NIRS[6].
Similar to fMRI and PET, NIRS[2,3] measures the local hemoglobin(Hb)concentration in the brain on the basis of the assumption that neuro-vascular coupling occurs. Neuro-vascular coupling refers to the relationship between neural activities and reactions in cerebral blood; i.e., the change in oxidation state of blood based on the proportion of oxyhemoglobin(oxyHb)/deoxyhemoglobin(deoxyHb) concentration relative to the increase in blood and blood flow around the active neurons. Neural activity requires energy available to the cells, in particularly, energy available for electrical excitation and biological reactions. During this process, carbon dioxide and water are released, and as carbon dioxide increases, the amount of blood in the tissue increases due to the extension of inflow and outflow blood vessels. That is, when neural activity occurs, blood vessels extend, and an adjustment mechanism works to supply sufficient arterial blood containing oxygen and glucose, as energy sources.
NIRS measures the changes in the amount of blood around the surface of the cerebrum by emitting near-infrared rays through an optical fiber located above the scalp. These rays pass through 2-3 cm below the scalp allowing hemoglobin absorption. This method is not invasive, as it uses class-I near-infrared lasers that are harmless to living organisms. Light within the range of 600-950 nm is not strongly absorbed by water and penetrates relatively deep into the body. NIRS measures the difference in wavelengths for oxyHb and deoxyHb (780/830 nm) in red blood cells due to absorption when the near-infrared rays pass through the brain. Upon activation, the amount of blood supplying oxygen to the active part of the brain increases. Near-infrared rays are scattered by Hb in the blood, allowing changes in oxyHb and deoxyHb and total Hb to be calculated for evaluation of the changes in the amount of blood in the cerebral cortex.
NIRS therefore can measure the metabolic changes in the brain circulation accompanying neural activities, as an indirect measure of brain function, rather than measuring neural activity itself.
However, the oxygen consumption dynamic monitor using NIRS is still debated over the reliability of its absolute value and the interpretation of the measurement results[7]. This holds not only when NIRS is used alone but also when it is used in conjunction with other diagnostics equipments. The purpose of this study is to contribute to a consensus regarding NIRS, over the reliability of its absolute value and the interpretation of the measurement results through alpha-blocking testing.
Needless to say, each diagnostic has its own characteristics, since the result of using more than one diagnostic equipment is not entirely overlapped. However, it is important that the result of the focused measurement diagnostics should be experimentally, logically, and precisely assumed by considering the result of the other diagnostics and the logic behind it as reference.
From this view point, based on the EEG measurement results of alpha-blocking[8] which is clinically important phenomenon and has achieved a wide consensus and a diagnostics of its measurement, we investigated the characteristic changes in the NIRS measurements. This is the first report to address the simultaneous use of NIRS and EEG measurements of alpha-blocking.
Frequency, direct current of cerebral blood flow, and information amount were analyzed based on time-series signals obtained during the simultaneous measurements of EEG and NIRS. Frequency is commonly used with the brain EEG measurements and was employed in this study to confirm appearance/disappearance of the alpha frequency during the alpha-blocking tests. Direct current analysis of cerebral blood flow is most commonly used with the NIRS measurements. Information amount analysis was first employed to analyze NIRS results in our previous study[9] and was employed in this study as a parameter of nervous activity complexity based on both primary (EEG) and secondary (NIRS) signals of nervous activity.
The results may contribute to step by step clarification on NIRS reliability.
With the EEG measurement of alpha-blocking, we investigated the characteristics of changes in the NIRS measurement signals corresponding to alpha-wave generation when the eyes were closed and alpha-wave extinction when the eyes were open.
Although direct current information such as high or low, increase or decrease of the blood flow has been mainly used in previous researches, in the NIRS measurement, it is also important whether significant information is contained or not other than such direct current information. This means that NIRS is a method for measuring the metabolic changes in brain circulation accompanied by neural activities, and that the conservativeness of the complexity of the original neural activity in the secondary signals is essentially important and is one of the issues that need clarification. The major feature parameters to be considered is that direct current (center of variation) and complexity of variation.
Information amount analysis was first employed to analyze NIRS results by the author[9] and was employed in this study as a parameter of the complexity of nervous activity as inferred from both primary (EEG) and secondary signals (NIRS) of nervous activity.
This issue also relates to the discussion such as whether the NIRS measurement signals are buried in the noise or fluctuations throughout the body. The noise or fluctuations of the living body has not been discussed, and there has been no consensus. Furthermore, there has been no consensus about the fluctuations of even EEG, which has a much longer history[10-12]. However, the following can be said about the phenomenon that has achieved a wide consensus and its measurement result. Regarding the phenomenon, the task as input and its measurement result as output, it can be considered that the information structure as a result of neural activities is not buried in the fluctuations or noise existing between the input and output, and therefore, is significant as information. Taking the significant information as a reference, from the correlation between the reference and the NIRS measurements, significant information in the NIRS measurements can be extracted.
Stationary processes and infinite observations are assumed for the calculation of the ordinary information amount. However, signals from the human body are strong non-stationary processes. In this paper, minimum description length (MDL), which is an information amount proposed for finite observations, is extended for non-stationary processes by introducing the attenuation parameter as a weighted MDL (WMDL)[9].
In Eq.(1), with ωt=1 (without attenuation), the first term corresponds to the ordinal entropy, and the second term corresponds to the correction term for finite observations in the ordinal MDL.
The complexity was considered on the changes of the difference values of  and were categorized into 26 states, and probabilities
  were calculated. The probability distribution of P is assumed as Gaussian and the parameter vector
  includes the mean and the distribution parameters and k=2. γ=0.99.
The maximum information amount is 6 in the case of 26 states.
The larger the complexity of a signal, the larger the information amount, and the smaller the complexity, the smaller the information amount.
The experiments by using EEG and NIRS in Center for Frontier Medical Engineering (CFME), Chiba University have been approved by the Ethics Committee of CFME and School of Medicine, Chiba University. The approval and the experiments using EEG and NIRS were carefully explained to the subjects and received consent prior to participation in the experiments. The seven subjects were a graduate school colleague of the first author, collaborators, friends and a graduate student of the second author. About disease has been pre-screened, and all were healthy. Hereafter, seven subjects are indicated using Subject 1 through Subject 7. Subject 1 through 6 are males aged 61, 46, 37, 41, 56 and 61, respectively, and Subject 7 is a female aged 28. The average age is 47.1, and the standard deviation is 11.8. Handedness is all right.
For each experiment, subjects were seated in a comfortable chair in a magnetically shielded room designed for EEG measurements. A quiet environment was maintained in the room and its surrounding area with no ambient noise. The NIRS equipment was SHIMADZU OMM-3000. EEG and NIRS were measured simultaneously using an EEG electrode fixed at the O1 position international 10-20 system and encircled by four NIRS probes, two diametrically opposing transmitting and receiving probes located apart(Fig. 1)
. Though, either O1, O2 may be selected in the visual cortex for alpha wave observation, O1 was selected as a sample in this study. Four NIRS channels were averaged to match the geometric mean with the location of EEG electrode. The average also intended to reduce the noise level into the order of 1/√4 known in statistics. The sampling frequency was 1000 Hz and 25 Hz for EEG and NIRS, respectively. The 1000-Hz sampling of EEG was down-sampled to 25 Hz for the same ring comparison with NIRS for calculating the information amount.
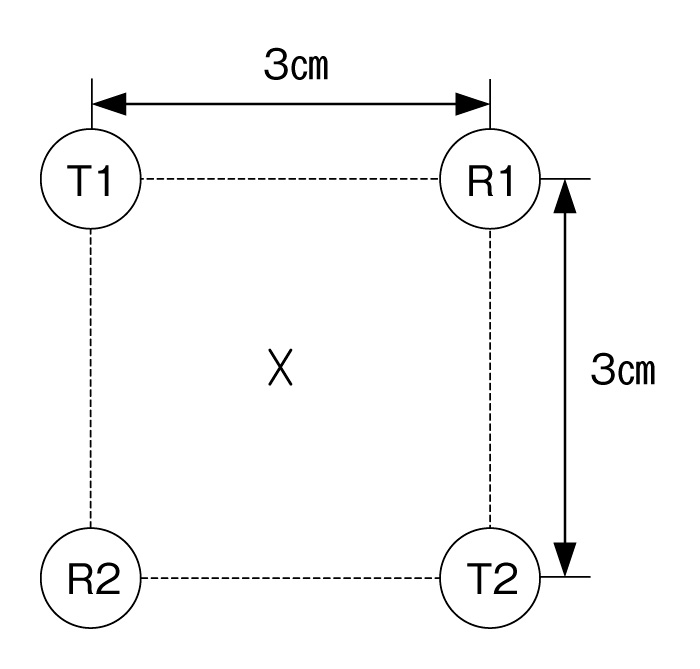
Fig. 1 Transmitting and receiving probes.
The alpha-blocking tests were performed while the eyes were opened then closed for 10-s intervals; the open/closed pattern was repeated five times. The examination was repeated five times for a total duration of 500-s for each subject.
Because probes conduct optical measurements while in contact with the scalp, performing measurements for a longer duration using a constant applied pressure while avoiding both pain and influence of hair was impossible. To minimize the influence of hair, care was taken to push the hair aside and achieve as much direct contact between the NIRS probes and the scalp as possible. To avoid subjects from experiencing pain caused by the applied pressure, care was also taken with respect to experimentation times.
Since body movement introduces artifacts in the results by causing changes in the applied probe pressure and altering blood flow in the scalp, and because moving the head alters venous return and hemoglobin levels, subjects were instructed to restrain from body and head movement before the start of the experiments. Subjects were also instructed to restrain from ocular motion and blinking as much as possible. In addition, because muscles are present in the head above the forehead and ears and below the scalp of the temple, subjects were instructed to restrain from muscle activity around the head.
The correlation between EEG and NIRS measurements was determined based on a correlation coefficient. For each 10-s time interval, the increase (indicated by s1) or decrease (indicated by s2) was determined. If the average value in the first 5 s is smaller than the average value in the last 5 s, then the time interval is classified as s1. If the average value in the first 5 s is larger than the average value in the last 5 s, then it is classified as s2.
Measurements are not expected to be affected by noise level variations. When there is almost no variation in a time interval (within ±3%), the following rules are applied. If the average measured value in a time interval is larger than that in the previous time interval, the time interval is classified as s1; in the opposite case, the time interval is classified as s2.
For frequency analysis of EEG, alpha-wave generation corresponds to s1 classification and alpha-wave extinction corresponds to s2 classification.
If two signals are the same classification at the same time interval, the correlation is 1.0; if they are different, the correlation is 0.0. The correlation coefficient is calculated using the average value for all time intervals. In the case of the inverse correlation coefficient, if two signals are different classifications, the correlation is 1.0, and if they are the same, the correlation is 0.0. The inverse correlation was employed for determining the correlation between EEG alpha-wave and NIRS oxyHb and between EEG alpha-wave and EEG information amount.
Before calculating the correlation, a smoothing curve fitting was performed with second-ordered polynomial curves on the wavelength range. In the following figures, the smoothed results were included.
Two types of correlations related to the direct current and the complexity were calculated. Correlation 1: the increase (or decrease) in the oxyHb level correlated with the alpha-wave extinction (or generation) of alpha-blocking. Correlation 2: the increase (or decrease) of NIRS signal information amount correlated with the increase (or decrease) of EEG signal information amount.
Alpha-wave disappearance during the transition from a closed to opened eye state, and alpha-wave appearance during the transition from an opened to closed eye state was confirmed for all data of all subjects. Fast Fourier transform was applied to each 10-s time interval, and the results indicated the possibility of using the alpha-blocking tests as a reference for all subjects. Figure. 2(a)(Fig. 2) and (b)(Fig. 2) show an example (reference alpha frequency (8 to 13 Hz)). These are calculated based on the original EEG sampling (1000Hz).
Figure. 2(c)(Fig. 2) shows an example of the frequency analysis results for the NIRS measurements. In the frequency analysis results for the NIRS measurements, no definite alpha-wave was found within alpha frequency. At most, the peak in alpha frequency was only 4% larger than that outside alpha frequency.
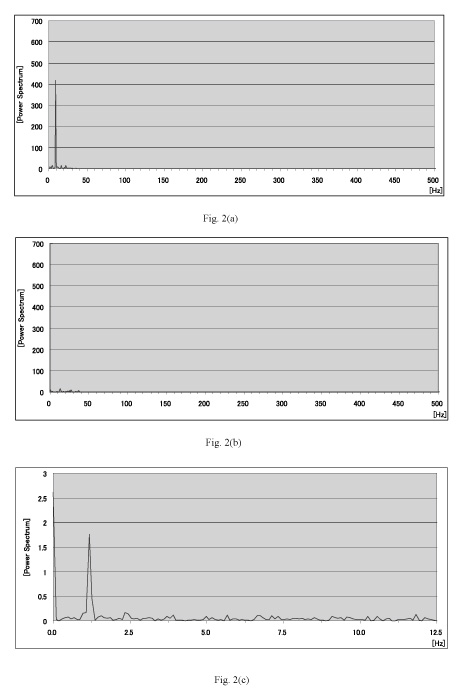
Fig. 2 Examples of frequency analysis corresponding to Subject1.
result whether or not including definite alpha-wave corresponding within alpha frequency.
The correlation between NIRS results and alpha-blocking was investigated. All figures show representative examples of the results of one experiment for the same subject. Figure3(Fig. 3) revealed a correlation between the increase in the oxyHb level when eyes are kept open during the interval of alpha-wave disappearance (inverse correlation=1 for the interval), and the decrease in the oxyHb level when eyes are closed during the interval of alpha-wave appearance (inverse correlation=1 for the interval). Using the increase/decrease in the oxyHb level, the correlation between alpha-blocking was calculated as a correlation coefficient, given in Correlation 1 in Table 1 (Table 1). The correlation coefficient of 0.806 was obtained for average data for all subjects at all time intervals.
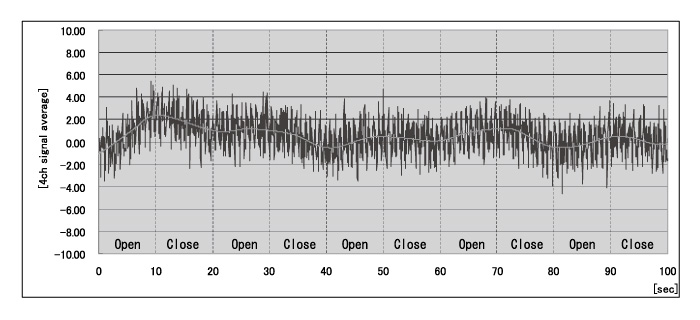
Fig. 3 Example of direct current analysis.
The graph shows representative results of the same subject as in Figure 2 for one experiment. The blue line represents the average NIRS signal for the four NIRS channels. The red line represents the smoothed result with the direct current extracted. Open and Close indicate the intervals when the subject’s eyes were opened and closed, respectively.
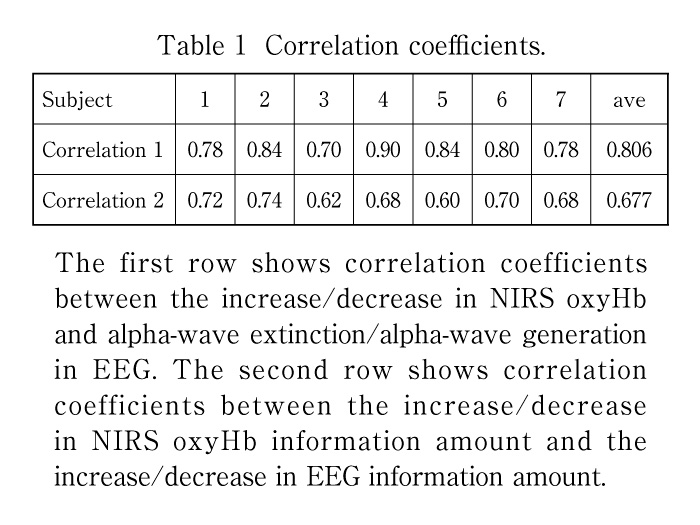
Information amount was analyzed as a parameter of complexity of neural activity. Information amount from EEG giving the primary signal of neural activity was compared with that from NIRS giving the secondary signal of neural activity. Measurements from the four NIRS channels were averaged for the information amount. Figure. 4(a)(b)(Fig. 4) show representative results of information amount determined for EEG and NIRS, respectively. For NIRS, information amount tended to increase when eyes are kept opened and to decrease when eyes are closed. This trend was similar to that for EEG signal information amount, although the extent of information amount (i.e., the level of increase or decrease) varied between methods. Thus, the increase (or decrease) of EEG signal information amount correlated with the increase (or decrease) of NIRS signal information amount. Correlation 2 in Table 1 (Table 1) shows the correlation between these parameters. Smoothing was applied to the information amount from EEG and NIRS signals, and correlation coefficients were calculated. The correlation coefficient of 0.677 was obtained for the average data of all subjects.
Consideration on Alpha-Blocking Diagnosis Using Near Infrared Red Spectroscopy
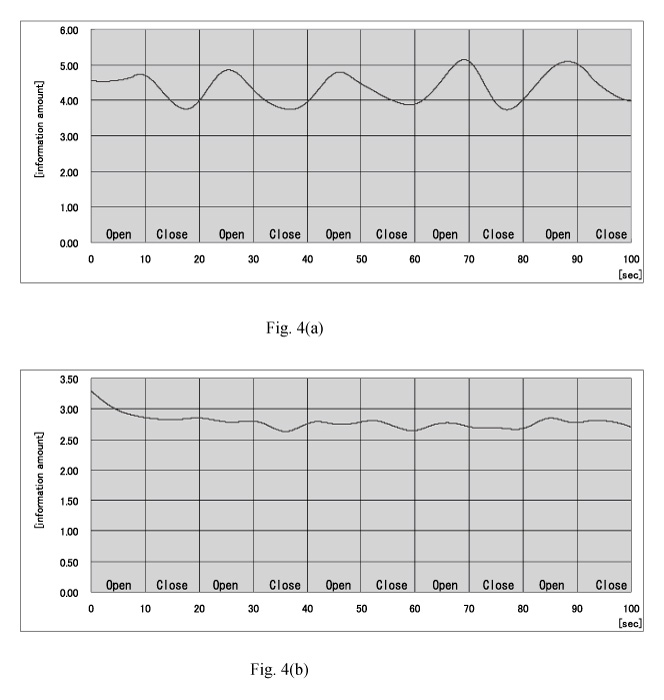
Fig 4. Examples of information amount analysis.
The graphs show representative results of the same subject as in Figure 2.
Table 2 (Table 2) summarized all of the relations between parameters in which the upper arrow indicates increase, and the lower arrow indicates decrease.
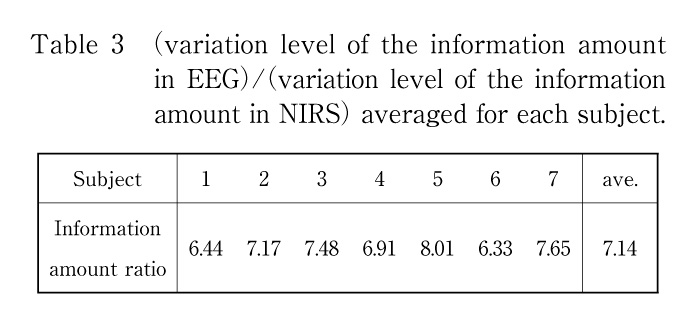
Table 3 (Table 3) shows the ratio of variation levels between EEG and NIRS in information amount that is (variation level for EEG)/(variation level for NIRS) for each subject averaged. The variation level was calculated between adjacent time sections in which states of eyes change. The differences between the maximum to the minimum change or the minimum to the maximum change in two adjacent time sections were calculated, and averaged for each subject.
NIRS is still under debate regarding the reliability of its absolute value and the interpretation of its measurement results. A previous study that evaluated simultaneous measurements using EEG and NIRS found correlations between these measurements[13], but did not evaluate the reliability or usefulness of NIRS for clinical application. They employed flash lightning with a variable on-off cycle as the task, which is not an approved task for evaluating EEG in regards to clinical application. Only alpha-blocking and diagnostics of epilepsy have been approved in the clinical application of EEG.
In this study, the NIRS measurements were compared with the EEG measurements of alpha-blocking as the task to achieve a consensus of this diagnostic method. This is the first report to evaluate alpha-blocking using the simultaneous measurements of EEG and NIRS. We also analyzed a specific parameter (information amount) related to the complexity of changes in the measurement signals from our previous study[9].
We found a correlation between NIRS results and alpha-blocking. When the oxyHb level increases when eyes are opened, there is an interval of alpha-wave disappearance, and when the oxyHb level decreases when eyes are closed, there is an interval of alpha-wave appearance.
Correlations were also found between the EEG and NIRS measurements for both direct current and information complexity. Thus, direct current extracted from NIRS oxyHb is correlated with alpha-blocking, and NIRS signal information reflects the neural activity complexity to some extent despite being secondary signals of neural activity.
Though, in Table 1 (Table 1) , there exist close numericals between Correlation 1 and Correlation 2, and not close numericals between the parameters, the results were from individual variations considering that Correlation 1 and Correlation 2 are mathematically independent parameters.
As known from Figure 4(Fig. 4) and Table 3 (Table 3), the variation level of the EEG information amount is 7.14 times larger than the variation level of the NIRS information amount, depending on the alternating opened eyes and the closed eyes. This is expected because the latter comprises secondary signals and is less complex than primary signals. Conversely, strong points of NIRS because of the flow of oxyHb is asynchronous in local vessels should be found out. Probably, alpha-blocking depends on a synchronization of neurons. It is estimated that the asynchronous in local vessels cause the higher spacial resolution of NIRS than EEG.
The alpha-frequency was not conserved in the NIRS measurements. As frequency conservation requires synchronization, the flow of oxyHb is asynchronous in local vessels despite the fact that the heartbeat controls overall blood flow. In the example shown in Figure 2(c)(Fig. 2), the peak around 1.2 Hz most likely corresponds to the heart beat.
Based on the correlations between the EEG and NIRS measurements, NIRS is expected to be applicable for alpha-blocking diagnostics, though EEG is the standard for alpha-blocking task. The results may contribute to step by step clarification on NIRS reliability.
医療診断を目的として,光を用いて生体の機能を計測する近赤外分光法(NIRS)は,最も実用化が進んでいる光診断法の一つであり,他の計測法にない幾つかの長所を有している。しかしながら,NIRSを用いた酸素動態モニター診断法は,絶対値の信頼性,計測結果の解釈について数多くの議論を残しているといる。アルファブロッキングタスクを用いた本論文の目的は,NIRSの信頼性に関するコンセンサスをステップバイステップで検証蓄積していくことにある。検証方法は,コンセンサスがとれているタスクとその計測による診断法をリファレンスとして,NIRSの信頼性を検証していく立場であり,アルファブロッキングタスクでの脳波計測をリファレンスとして,NIRSでのアルファブロッキング診断の可能性に関する考察を行った。結果として,アルファブロッキングとNIRS計測信号の変動特徴間の相関係数として0.806という高い値を得た。さらに脳波のアルファリズムやNIRSの酸素代謝の増減といった特徴パラメータ以外に,計測信号の変動の複雑さに関わる特徴パラメータ(情報量)についても考察した。その結果,神経活動にカップリングした1次信号(脳波)と2次信号すなわちNIRSの酸素代謝の複雑さの変動特徴間の相関係数として0.677が得られ,このパラメータにも,アルファブロッキングに関わる情報がある程度保存されていることが分かった。EEG計測信号の情報量の変動レベルは,NIRS計測信号の情報量の変動レベルの7.14倍であり,アルファブロッキングタスクにおいては,EEG計測信号により多くの情報が含まれていることが分かった。しかしながら相関係数の結果は,アルファブロッキング診断へのNIRS適用可能性を示している。本研究は,NIRSによる診断の信頼性に関するコンセンサス形成に寄与するものであると考えられる。
松代信人1),下山一郎2),山下弘毅1),中澤 健3),笠置泰史2): 脳波と光トポグラフィの同時計測に基づく光トポグラフィを用いたアルファブロッキング診断の検討.
Tel. 043-290-3118. Fax. 043-290-3118. E-mail: medhosefun@gmail.com
2010年7月14日受付,2010年12月9日受理.