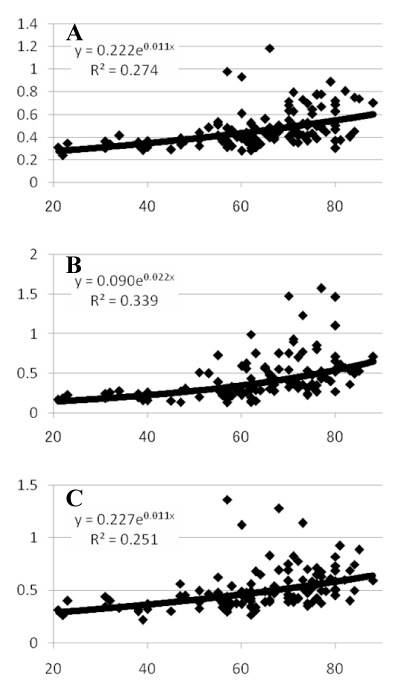
Fig. 1
A: The upper graph was visual cognition-reaction time and age. A regression line showed[Reaction Time]=0.222×e(0.011×[AGE]), R2: 0.274, mean RT was 0.48 sec±0.17 (standard deviation). B: The middle graph was auditory cognition-reaction time and age. A regression line showed[Reaction Time]=0.09×e(0.022×[AGE]), R2: 0.339, mean RT was 0.44 sec±0.28 (standard deviation). C: The lower graph was vibratory cognition-reaction time and age. A regression line showed[Reaction Time]=0.227×e(0.011×[AGE]), R2: 0.251, mean RT was 0.51 sec±0.20 (standard deviation). The abscissa represents reaction time in sec, and the ordinate represents age in years, for all graphs.