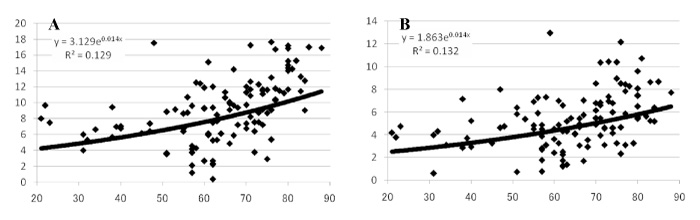
Fig. 2
A: The upper graph was right-left-orientation-cognition-reaction time and age. A regression line showed[Reaction Time]=3.129×e(0.014×[AGE]), R2: 0.129, mean RT was 9.12 sec±4.01 (standard deviation). B: The lower graph was short-term-memory-cognition-reaction time and age. A regression line showed[Reaction Time]=1.863×e(0.014×[AGE]), R2: 0.132, mean RT was 5.26 sec±2.45 (standard deviation). The abscissa represents reaction time in sec, and the ordinate represents age in years, for all graphs.