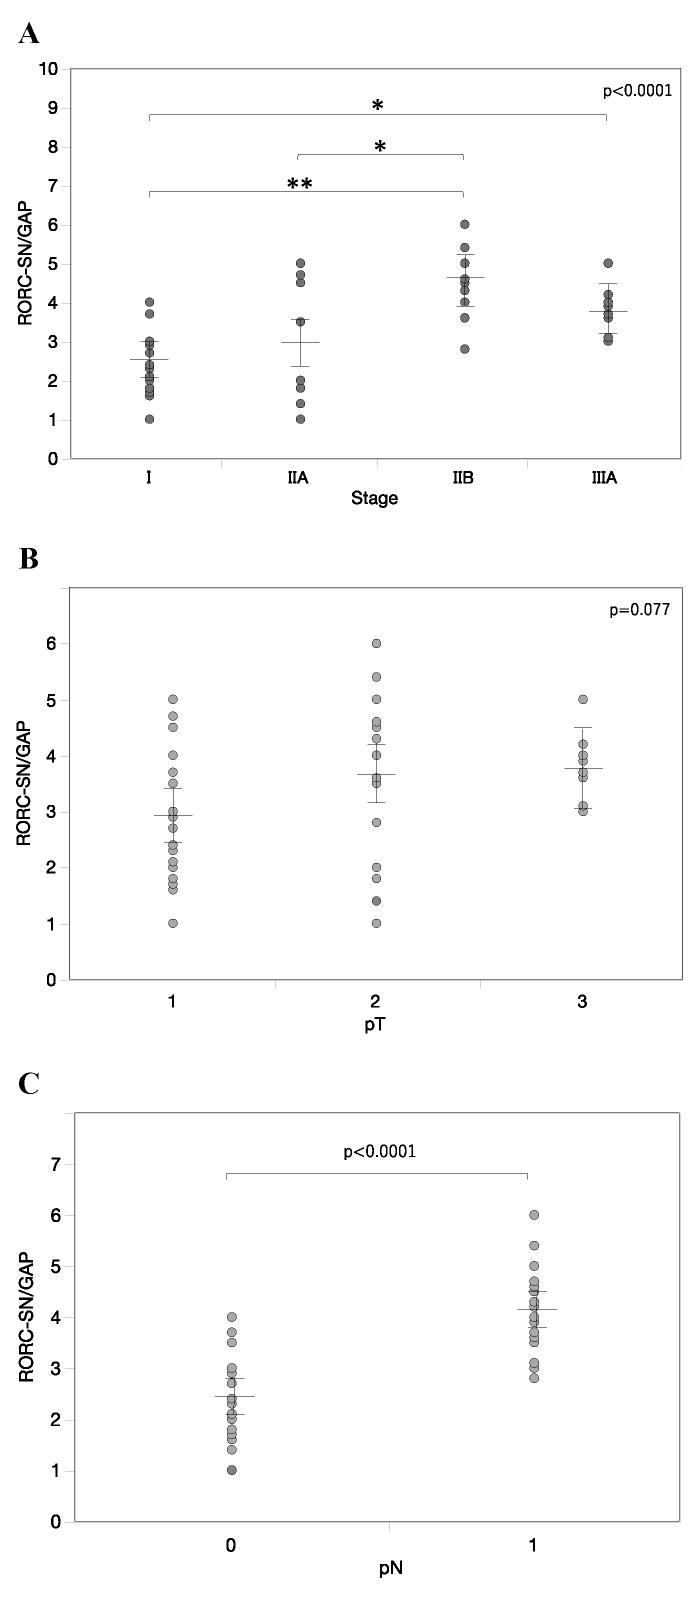
Fig. 2 RORC gene expression in SLNs with the occurrence of lymph node metastasis. A-C, RORC mRNA levels in SLNs of varying clinical stages (A) , tumor sizes (B) and nodal statuses (C) . Relative mRNA levels are represented as mean ± SEM. P-value was calculated by one-way ANOVA (A, B) or Student’s T-test (C) . *p<0.05, **p <0.01 by post-hoc test (Tukey-Kramer method) .
