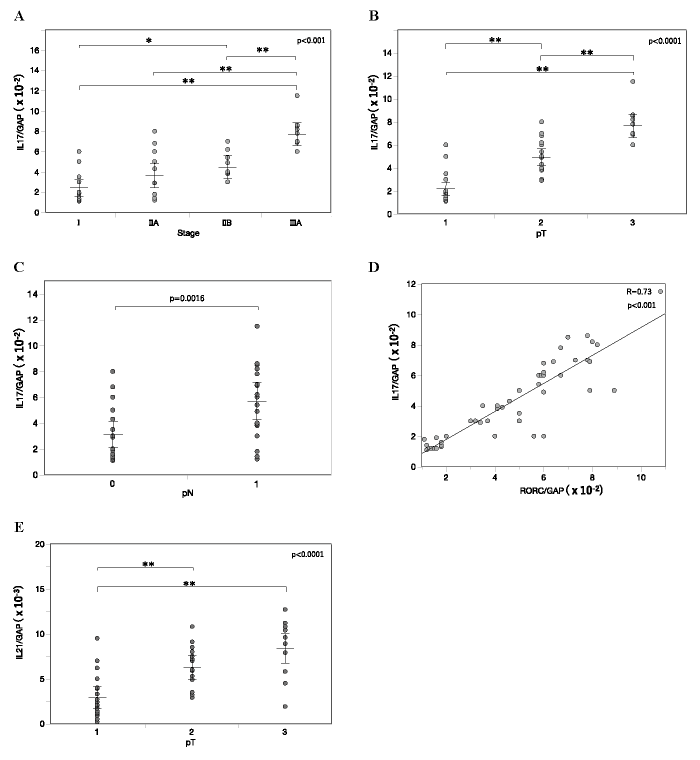
Fig. 3 IL-17 and IL-21 gene expression in the main tumor. A-C, IL-17 mRNA levels in the main tumor of varying clinical stages (A) , tumor sizes (B) and nodal statuses (C) . D, Linear least-squares regression analysis between mRNA levels of RORC (Fig. 1) and IL-17 in the main tumor. E, IL-21 mRNA levels in the main tumor of varying tumor sizes. In (A-C, E) , Relative mRNA levels are represented as mean ± SEM. P-value was calculated by one-way ANOVA (A, B, E) or Student’s T-test (C) . *p<0.05, **p<0.01 by post-hoc test (Tukey-Kramer method) .