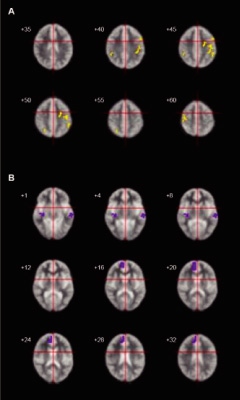
Fig. 2
(A) Yellow regions denote areas in which more activation was observed in normal controls than in high-functioning autistic patients. (B) Purple regions denote areas in which more activation was observed in high-functioning autistic patients than in normal controls. The number at the upper left of each axial section denotes the axial position relative to the intercommisural line (in millimeters) (i.e., the z coordinate). The right side of each slice represents the left side of the brain. A vertical line of the red cross indicates x coordinate of 0 and a horizontal line indicates y coordinate of 0 in the standard space of Talairach & Tournoux (1988). |